
Extended Data Fig. 2. Fourier Shell Correlation (FSC) curves.
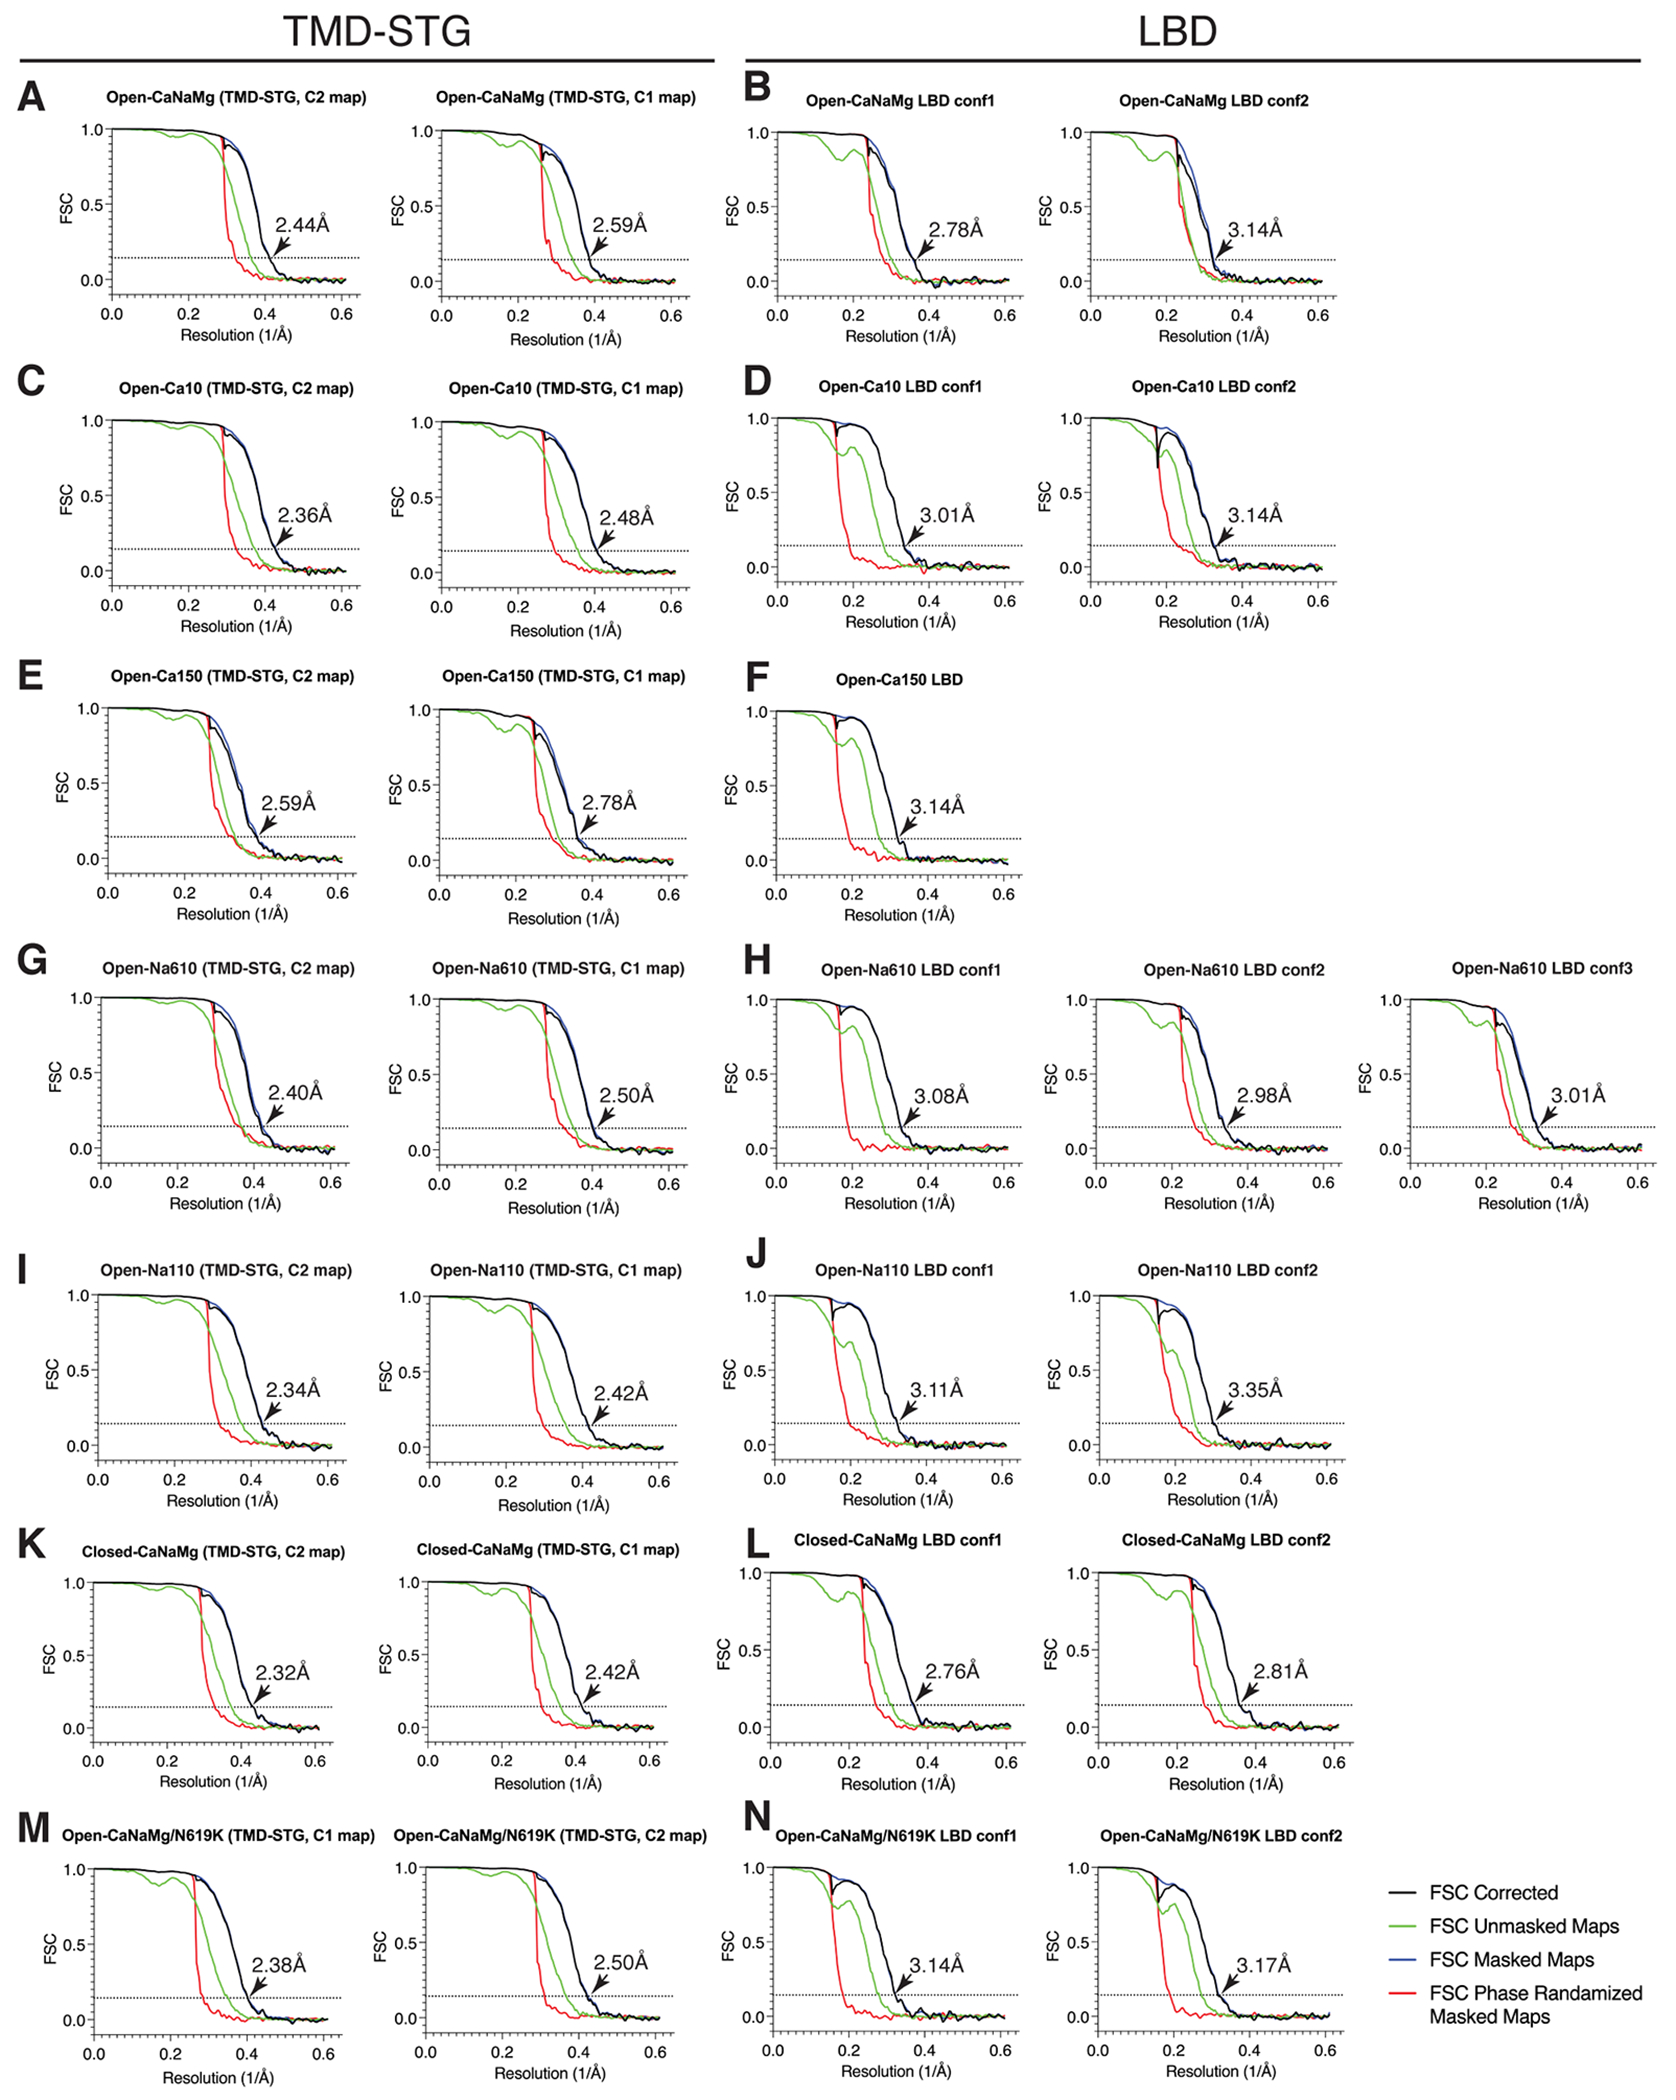
The FSC curves of the GluA2/TARP complexes presented in this work. The membrane embedded portion of the structures were refined using the TMD-STG mask, with (C2) and without (C1) imposing symmetry (A, C, E, G, I, K, and M). The LBDs were refined using the LBD mask with C2 symmetry imposed (B, D, F, H, J, L, and N). A-B. Open-CaNaMg. C-D. Open-Ca10. E-F. Open-Ca150. G-H. Open-Na610. I-J. Open-Na110. K-L. Open-CaNaMg/N619K. M-N. Closed-CaNaMg. The FSCs and final resolutions were calculated using Relion. FSC=0.143 is indicated by dashed line. Resolution is indicated by the arrows and numbers. Note: FSC curves of Open-Na260 are provided in Extended Data Fig. 1 F2 and F4.