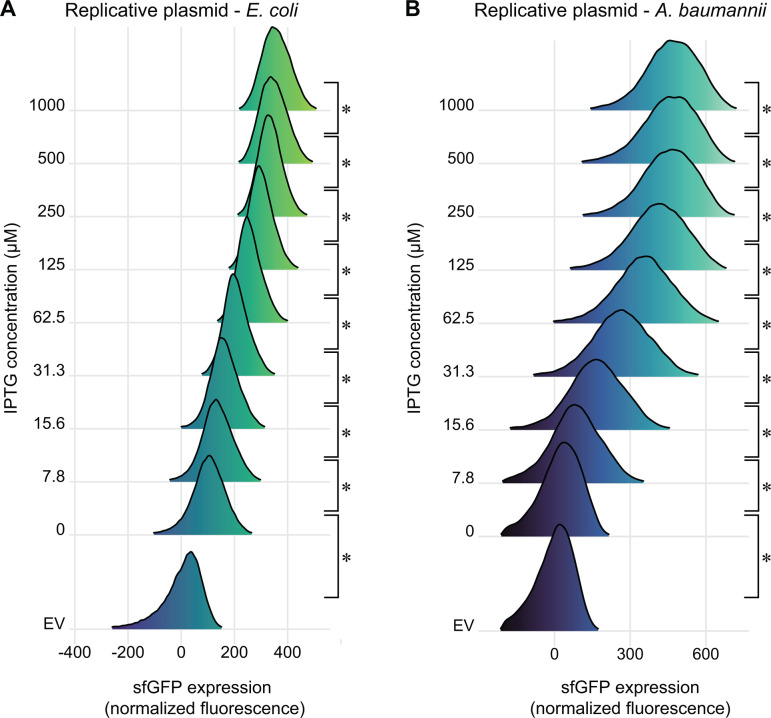
Fig 4.
Titration of PabstBR expression at the single-cell level. Titration of sfgfp expression from the replicative expression vector, under control of PabstBR, in (A) E. coli BW25113 or (B) A. baumannii ATCC 17978. Ridgeline plots depict overlapping density plots of sfGFP fluorescence for cells induced at different IPTG concentrations, measured by flow cytometry (~70,000 cells per sample). EV are empty vector (no GFP) control samples in 1 mM IPTG. Asterisks indicate significant sample differences (Welch’s t-tests; P-values < 0.05).

