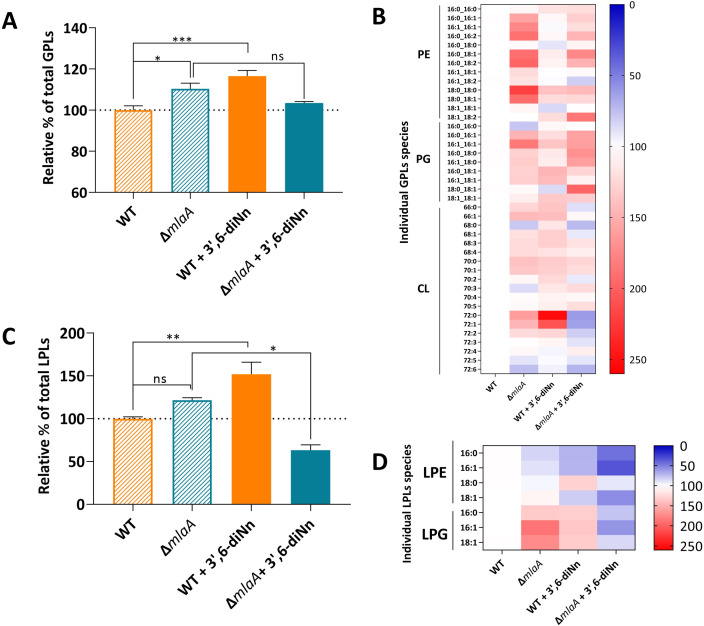
Fig 1.
Glycerophospholipids and lysophospholipids profile P. aeruginosa WT and ∆mlaA in the presence or absence of 3’,6-dinonyl neamine (1× MIC, 2 µg/mL, 1 h). (A and C) Total glycerophospholipids. (B and D) Heat maps of individual glycerophospholipids and lysophosphoglycerides species. Red-filled, blue-filled, and white-filled lines referred to increased, decreased, and unchanged levels of lipid structures, respectively. Total lipids were determined by using a fluorescent probe FM4-64, and individual lipids PE, PG, CL, LPE, and LPG were analyzed by LC-MS. The results are expressed in % where WT is considered 100%. Statistical analysis was performed using one-way ANOVA with Tukey’s multiple-comparison test. (A and C) ***P < 0.001, **P < 0.01, *P < 0.05; ns P > 0.05.

