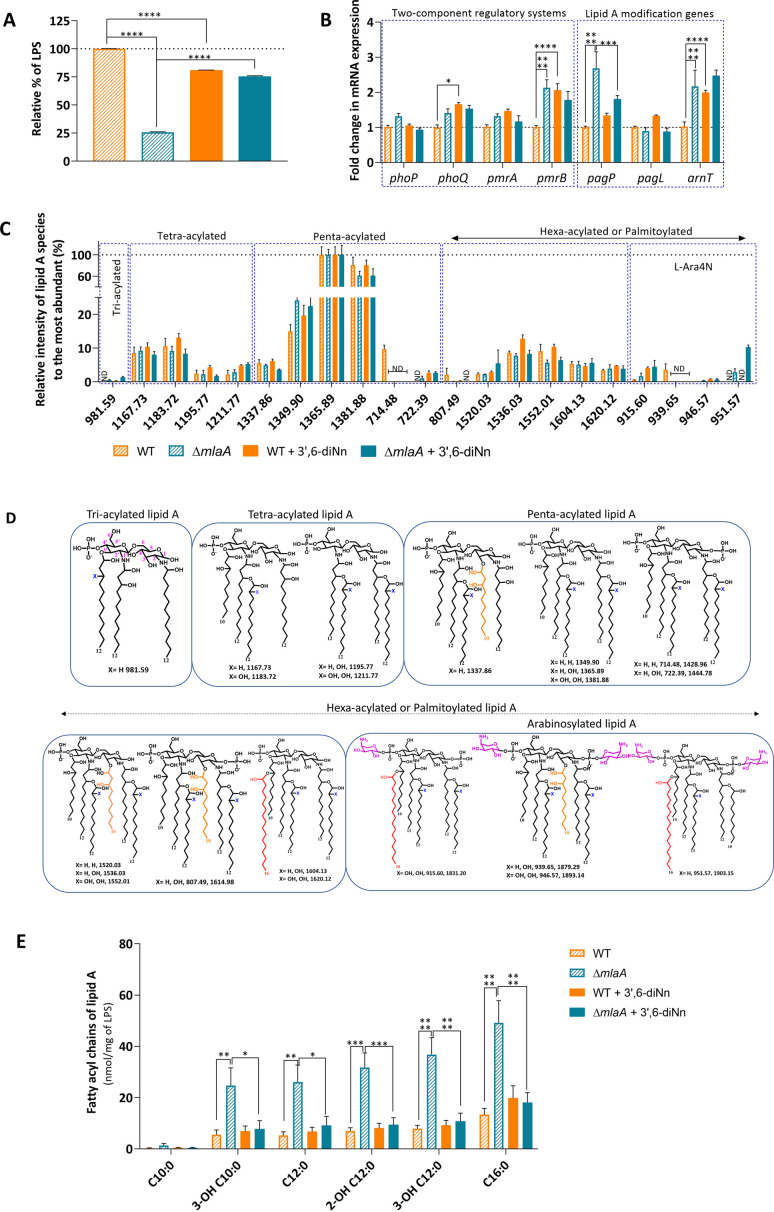
Fig 2.
Lipopolysaccharides (LPS) and lipid A modifications in P. aeruginosa WT and ∆mlaA non-treated and treated with 3’,6-dinonyl neamine (1× MIC, 2 µg/mL, 1 h). (A) Total LPS was measured by purpald assay. The results are expressed in relative % over P. aeruginosa WT, considered 100% (13,444 ± 16 µg/mL). (B) mRNA expression of two-component regulatory systems (phoP, phoQ, pmrA, and pmrB,) and lipid A modifications genes (pagP, pagL, and arnT). The results are expressed in fold change over P. aeruginosa WT. (C) MS peaks (m/z) obtained by ESI-MS (negative ion mode) shown in different boxes as tri-acylated, tetra-acylated, penta-acylated, hexa-acylated, palmitoylated, and arabinosylated with their relative intensity compared with the major peak for each condition (m/z 1365.89). (D) Predicted structures of lipid A structures from m/z were obtained. The positions of the acyl chain are hypothetical; 4-aminoarabinose added by ArnT is shown in purple, and palmitate chain added by PagP is shown in red on lipid A structures. (E) Fatty acids were isolated from lipid A structures and analyzed as FAMEs using gas chromatography - mass spectrometry (GC-MS). Statistical analysis was performed by two-way ANOVA with multiple comparisons (B, C, E) and one-way ANOVA with Tukey’s multiple-comparison test (A) ****P < 0.0001, ***P < 0.001, *P < 0.05, ND undetectable. All values are given in mean ± SEM, and the experiment was repeated thrice.

