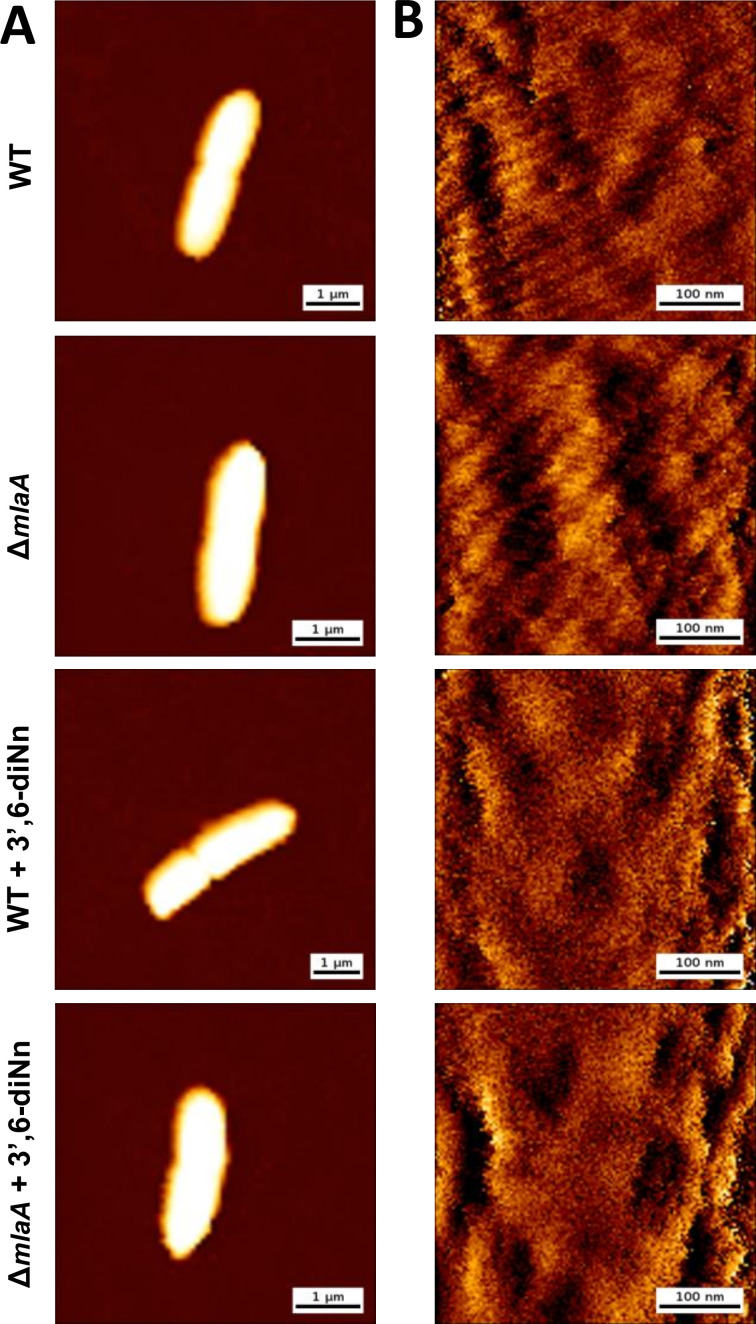
Fig 4.
AFM topographical characterization of P. aeruginosa WT and ∆mlaA non-treated and treated with 3’,6-dinonyl neamine (1× MIC, 2 mg/L, 1 h). (A) Representative AFM height images of P. aeruginosa WT and ΔmlaA strains, before and after treatment with antibiotic 3’,6-dinonyl neamine (1× MIC, 2 µg/mL, 1 h). Color scale: 650 nm. (B) High-resolution height images were recorded on top of the cells. Color scale: 20 nm. The images were recorded in phosphate-buffered saline (PBS), and the cells were immobilized on glass-bottom dishes previously functionalized with poly-L-lysine.

