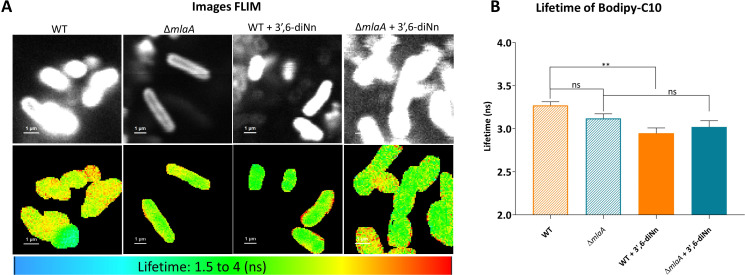
Fig 5.
FLIM images with their lifetime. P. aeruginosa WT and ∆mlaA in the presence and absence of 3’,6 dinonyl neamine (1× MIC, 2 mg/L, 1 h). (A) Top panels are intensity images, and the below panels are pseudo-colored FLIM images. (B) Lifetime measurements of the bacteria stained with BODIPY-C10. The data were obtained from two individual experiments, and in each experiment, at least 10 bacteria or three slides were considered to measure the lifetimes. The data are presented as means ± SD from three independent replicates. Statistical analysis was performed by one-way ANOVA with Tukey’s multiple-comparison test. **P < 0.01 and ns P >0.05.

