
Figure 5.
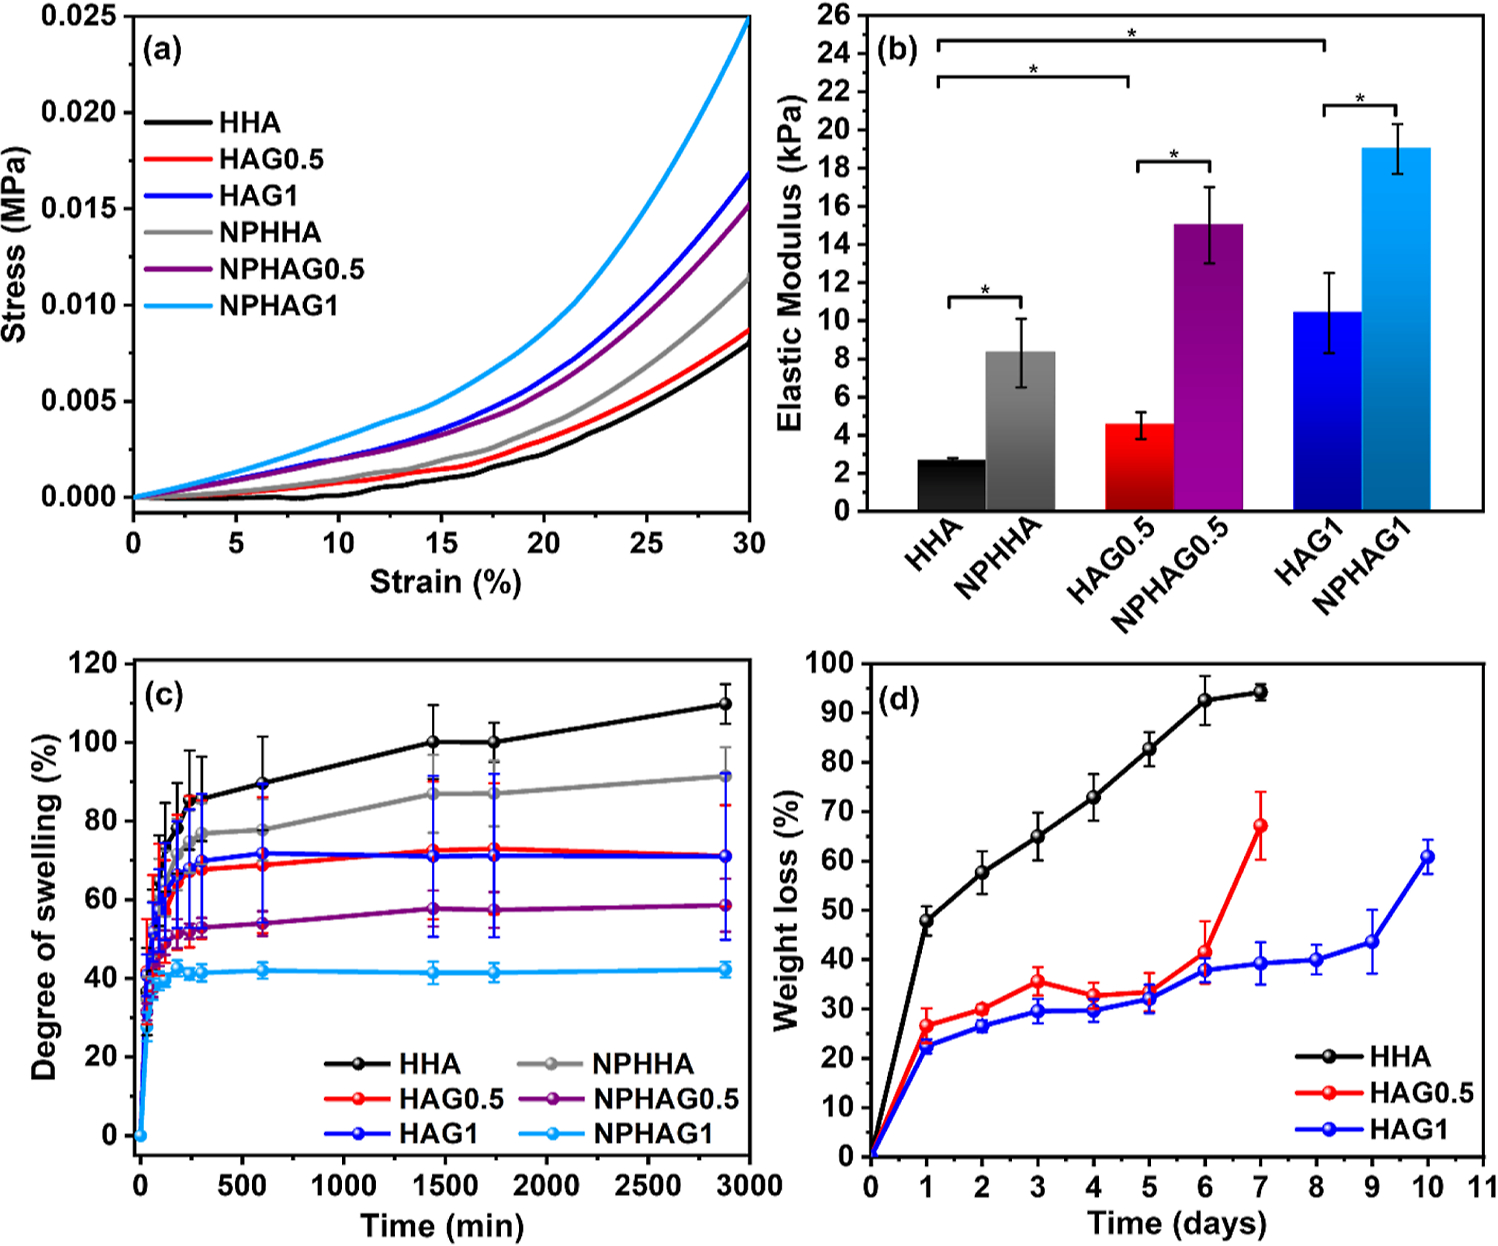
(a) Stress–strain curves of HHA, NPHHA, HAG0.5, NPHAG0.5, HAG1, and NPHAG1 (b) elastic modulus extracted from the curves of (a). (c) Swelling curves of HHA, NPHHA, HAG0.5, NPHAG0.5, HAG1, and NPHAG1 in PBS solution (pH 7.4). (d) ML of HHA, HAG0.5, and HAG1 during the in vitro degradation assay in the presence of hyaluronidase.