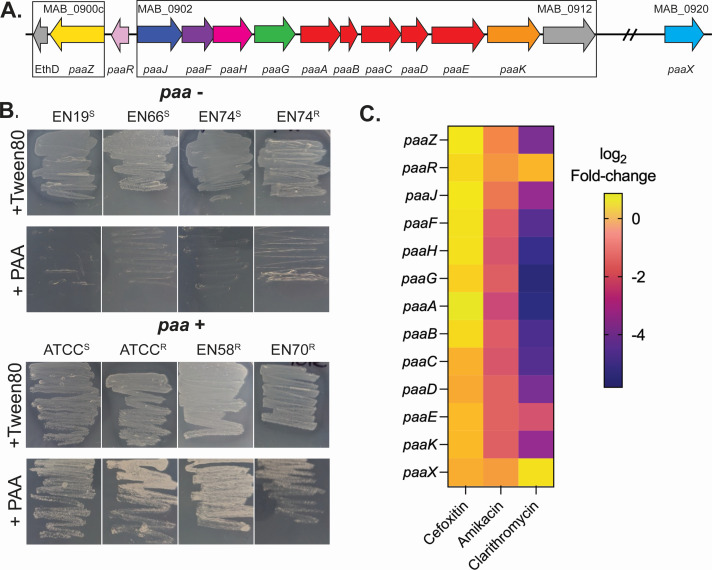
Fig 5.
MAB strains containing paa genes grow with PAA as the sole source of carbon and energy. (A) The MAB DNA region encoding paa genes. Putative operons are boxed. (B) MAB isolates were grown on MOPS minimal media with either 20 mM Tween-80 or phenylacetic acid (PAA) as the sole carbon and energy source and growth imaged after 96 hours. Representative images are shown. Morphotype, rough (R) or smooth (S), is denoted by the superscript in the isolate name. (C) To investigate paa gene expression upon exposure to antibiotics, publicly available transcriptomes from MAB with and without exposure to amikacin, cefoxitin, and clarithromycin were compared. Shown is the differential gene expression of paa genes, with negative numbers indicating reduced expression upon antibiotic exposure.

