Fig 1.

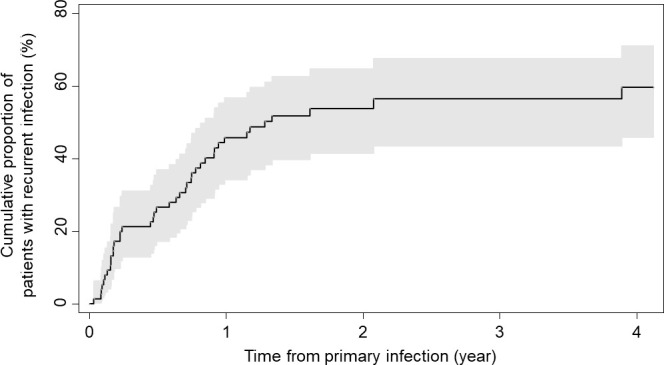
Cumulative incidence function of recurrent ventricular assist device infection for all cases. Shaded area represents the confidence interval around the curve.

Cumulative incidence function of recurrent ventricular assist device infection for all cases. Shaded area represents the confidence interval around the curve.