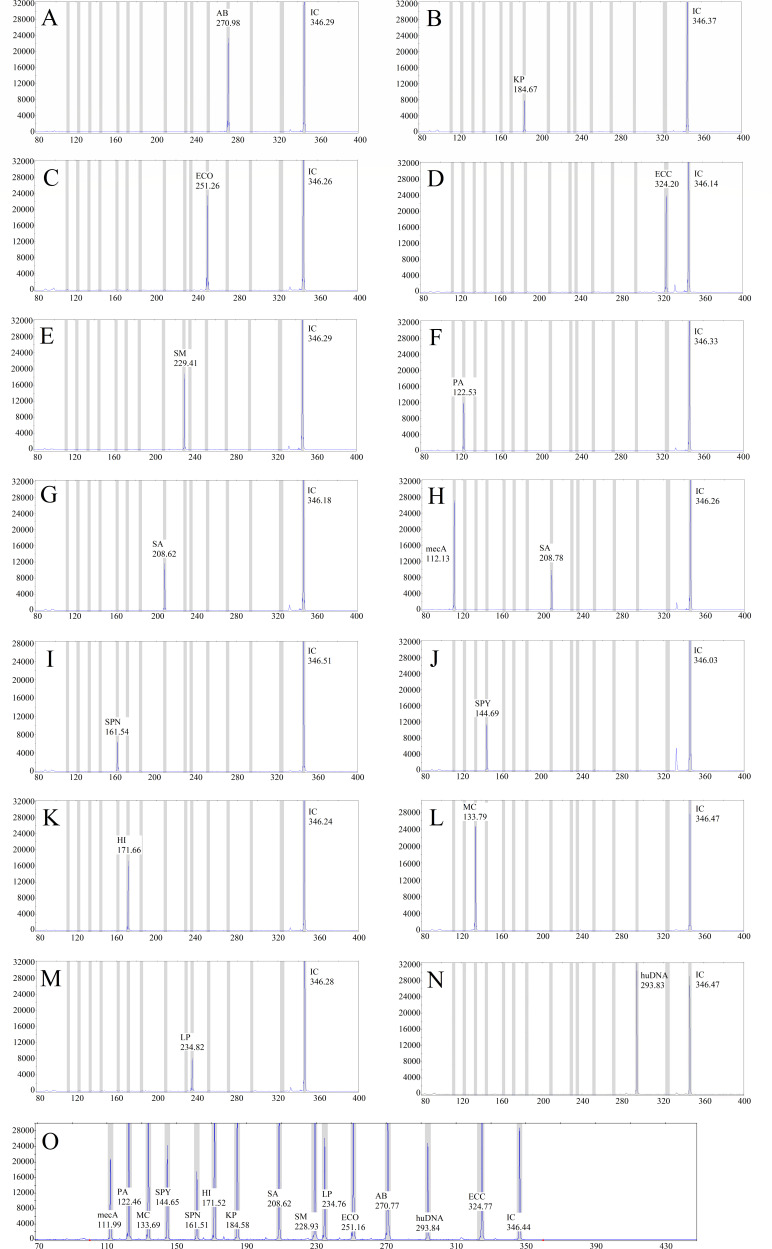
Fig 1.
Map of standard strains and positive/negative controls detected via MPCE. The X-axis indicates the PCR product size (nt), and the Y-axis indicates the fluorescence signal intensity (RFU). (A) Result for Acinetobacter baumannii. (B) Result for Klebsiella pneumoniae. (C) Result for Escherichia coli. (D) Result for Enterobacter cloacae complex. (E) Result for Stenotrophomonas maltophilia. (F) Result for Pseudomonas aeruginosa. (G) Result for Staphylococcus aureus. (H) Result for methicillin-resistant S. aureus. (I) Result for Streptococcus pneumoniae. (J) Result for Streptococcus pyogenes. (K) Result for Haemophilus influenzae. (L) Result for Moraxella catarrhalis. (M) Result for Legionella pneumophila. (N) Result of the negative control. (O) Result of the positive control.

