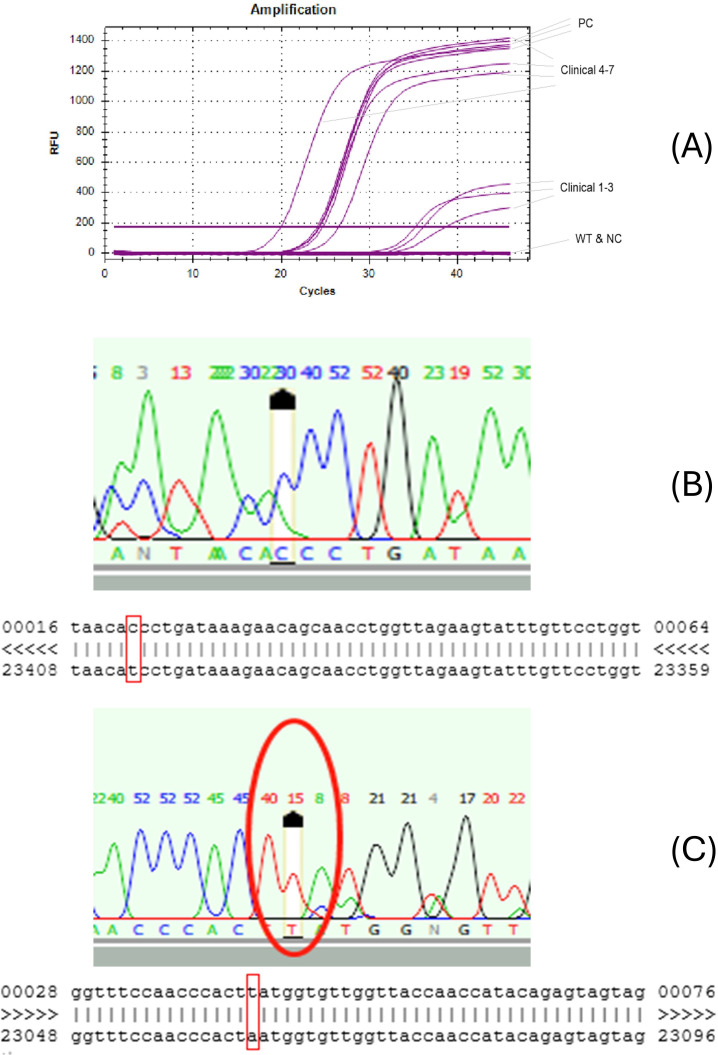
Fig 3.
(A) Representative RT-qPCR amplification curves of SARS-CoV-2 variant N501Y. PC, positive control; WT, wild type; NC, negative control. Clinical, clinical samples 1–7. (B and C) Confirmation of D164G and N501Y mutations by Sanger sequencing. (B) Sanger sequencing peaks (C in the red circle: D614G mutant). Sequence alignment of D614G, red squares indicate D164G mutant sequence T < C. (C) Sanger sequencing peaks (T in the red circle: N501Y mutant). Sequence alignment of N501Y. Red squares indicate N501Y mutant sequence A < T.

