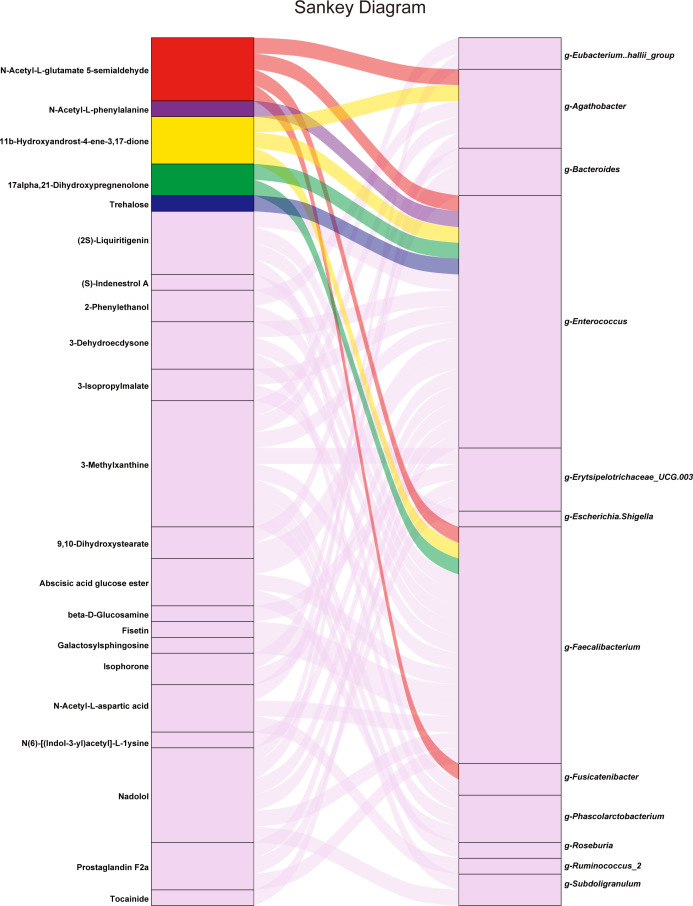
Fig 6.
Correlations between differentially abundant bacteria and fecal metabolites. This Sankey diagram was constructed based on the following correlation analysis of the top 50 differentially abundant microbiota members and metabolites, we constructed this Sankey diagram based on a significance threshold of P < 0.05 to select the relevant correlations. The diagram highlights five differentially abundant metabolites (shown in color), which are annotated to human KEGG pathways, correlating with four differentially abundant microbes. The metabolites that were not identified as being associated with human KEGG pathways are shown in the background color. The overall size of the rectangle for each microbe or metabolite is representative of the number of correlations between them, providing a visual scale of interaction strength and relevance.

