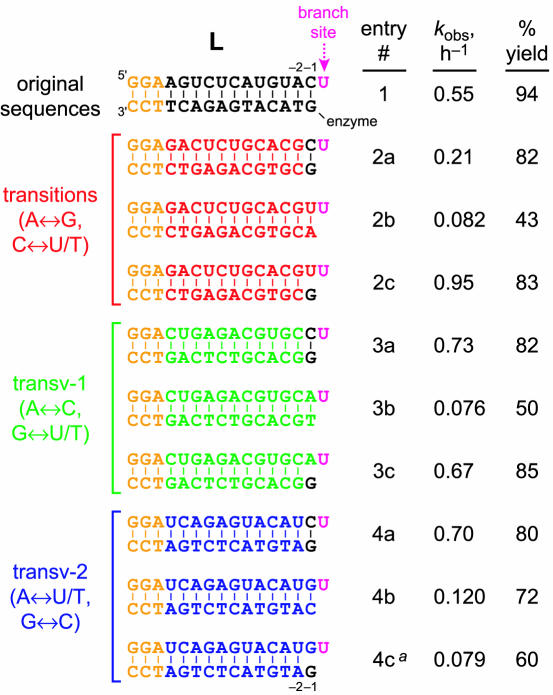
Figure 5.
Effects on 6CE8 ligation activity of changes to the L substrate nucleotides for RNA positions in the DNA-binding region. Incubation conditions were the same as for Figure 3A (20 mM Mn2+). The RNA substrate sequence is shown on top (5′–3′), and the complementary DNA is shown below the RNA. The leading 5′-GGA sequence (orange) was kept constant to permit transcription of each substrate. The nucleotide opposite the branch-site uridine (pink) was A in all the cases and is omitted from these images because the data suggest that there is not a Watson–Crick base pair at this position (see text). In addition, the AUCG nucleotides of the L substrate to the 3′-side of the branch-site U are omitted for clarity. The yield is from an exponential curve fit to the yield versus time data unless kobs < 0.15 h−1, in which case the yield is from the 24 h data point. See Supplementary Material for plots of the datasets. aThe same experiment except with A instead of G in the DNA at position −1 gave much lower rate and yield (data not shown).

