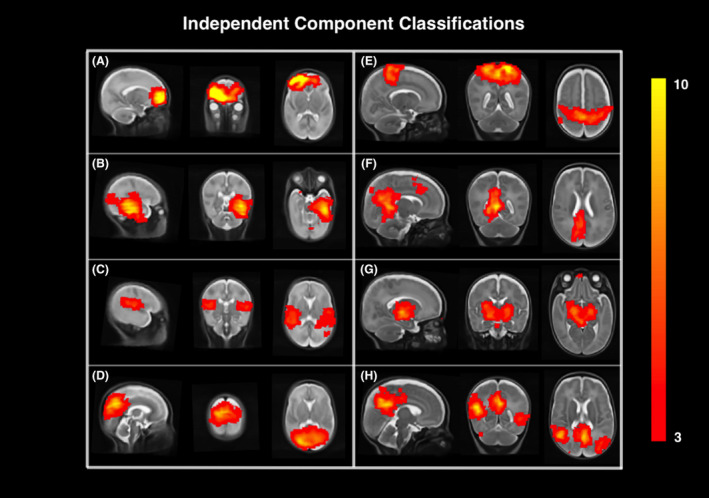
Figure 3.

Spatial maps of independent component analysis. Representative spatial maps showing the independent component analysis results of resting‐state functional MRI data on sagittal, coronal, and axial slices of the early‐in‐life (A–D) and term‐equivalent age (E–H) T2‐weighted brain template. Labeled signal of neuronal activity networks are displayed in red to yellow colors, with the color bar demonstrating the image intensity threshold (z‐scored) on the right. (A) Frontal lobe, (B) temporal lobe, (C) auricular network, (D) parietooccipital area, (E) sensorimotor area, (F) posterior cingular cortex, (G) basal ganglia, (H) default mode network.
