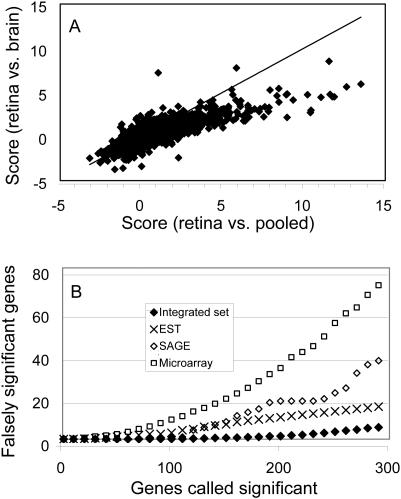
Figure 2.
(A) Correlation of summary scores between the comparisons of retina versus brain and retina versus ‘pooled’; x-axis is the score from the comparison of retina versus ‘pooled’ and the y-axis is from retina versus brain. The line is for perfect correlation and only used for eye guide. (B) False discovery rates for EST, SGE, microarray and integrated data sets; x-axis is the number of significant genes and y-axis is the genes falsely called significant.

