
Figure 2.
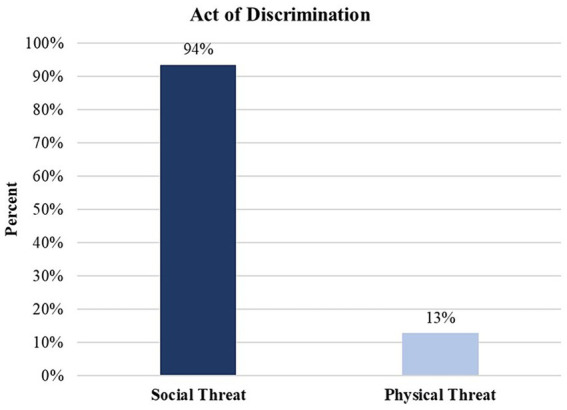
Act of discrimination experienced by AI/AN participants. Percentages represent the number of times the type of threat occurred across all participant excerpts divided by the total number of study participants (n = 294). As a consequence, they are not mutually exclusive codes. Some participants reported both social threats and physical threats, or not at all. Thus, the percentages presented in this figure exceed 100%. A chi-square goodness of fit test was performed to assess differences in the frequency of acts of discrimination, Χ2(1) = 179.45, p < 0.0001. Results suggest that social threats are the most prevalent act of discrimination, more common than physical threat.