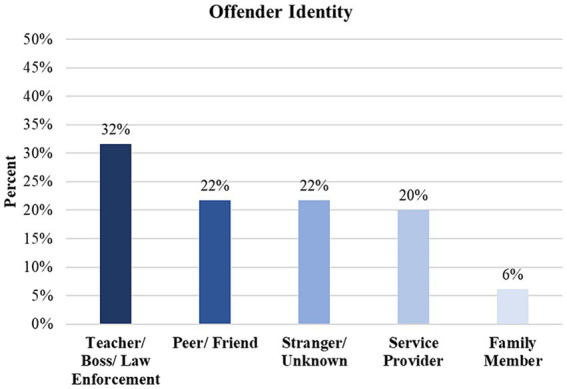
Figure 3.

General identity of offender who committed a discriminatory act. Percentages represent the figures of authority of the offender identities divided by the total number of study participants (n = 294). As such, multiple types of offenders may have appeared in certain participants’ excerpts. Thus, the percentages presented in this figure exceed 100%. A chi-square goodness of fit test revealed significant differences in observed frequencies among the offender subtypes, Χ2(4) = 48.41, p < 0.0001. These findings suggest that authority figures, such as teachers, bosses, and law enforcement figures are more commonly perceived as perpetrators compared to other offender subtypes.
