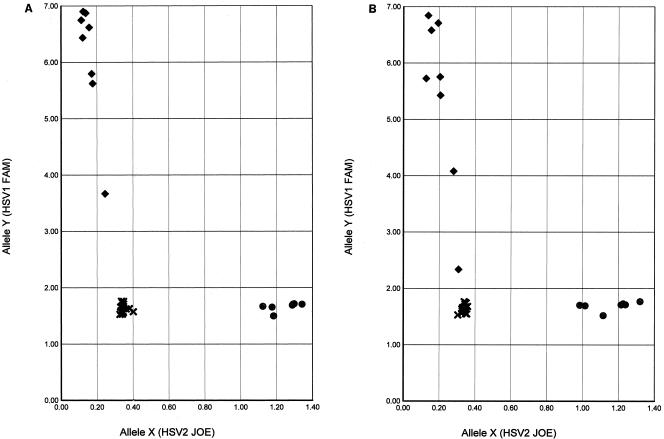
FIG. 3.
Plots showing fluorescence during real-time PCR and from post-PCR plate read after PCR on ABI 7000 (A) and ABI 9700 (B) instruments in a run analyzing 32 samples, of which 8 were HSV-1, 7 were HSV-2, and 17 were negative. The x axis shows fluorescence (delta Rn) from JOE/HSV-2, and the x axis shows delta Rn for FAM/HSV-1.

