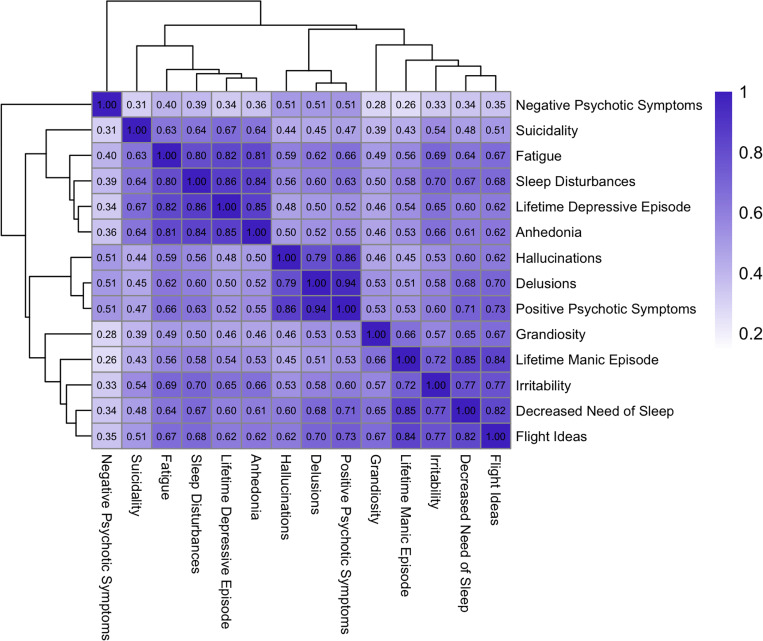
Figure 3. Jaccard similarity matrix of phenotypes including all PUMAS cohorts.
Each cell in the matrix corresponds to the Jaccard’s Similarity of two phenotypes, calculated as the proportion of instances where both phenotypes are endorsed relative to the total number of instances where at least one of the phenotypes is endorsed. The gradient scale from light to dark reflects the range of Jaccard Similarity Scores, from 0 (no similarity) to 1 (perfect similarity).

