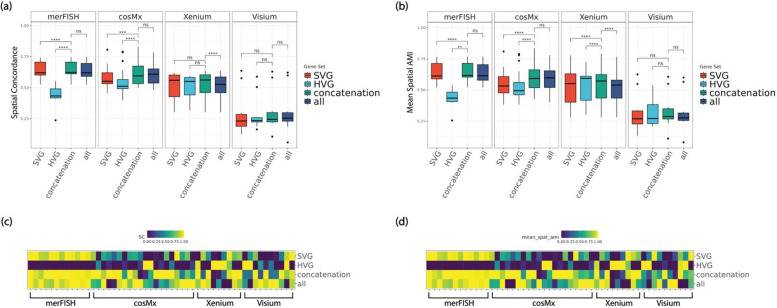
Figure 5.
Comparisons of spatial clustering performance of default clustering method (Leiden) on 51 real spatial transcriptomics datasets, in four representative platforms including merFISH, cosMx, Xenium, and Visium at default HV genes threshold level (low) and default SV genes threshold level (low). (a, b) boxplots of SC (Spatial Concordance) and Mean Spatial AMI, divided by platform. (b, d) heatmaps of SC and Mean Spatial AMI, ordered by platform. Note: ****: p-value<1e-3; ***: 1e-3 ≤ p-value < 1e-2; **: 1e-2 ≤ p-value < 5e-2; *: 5e-2 ≤ p-value < 0.1; ns: 0.1 ≤ p-value ≤ 1.

