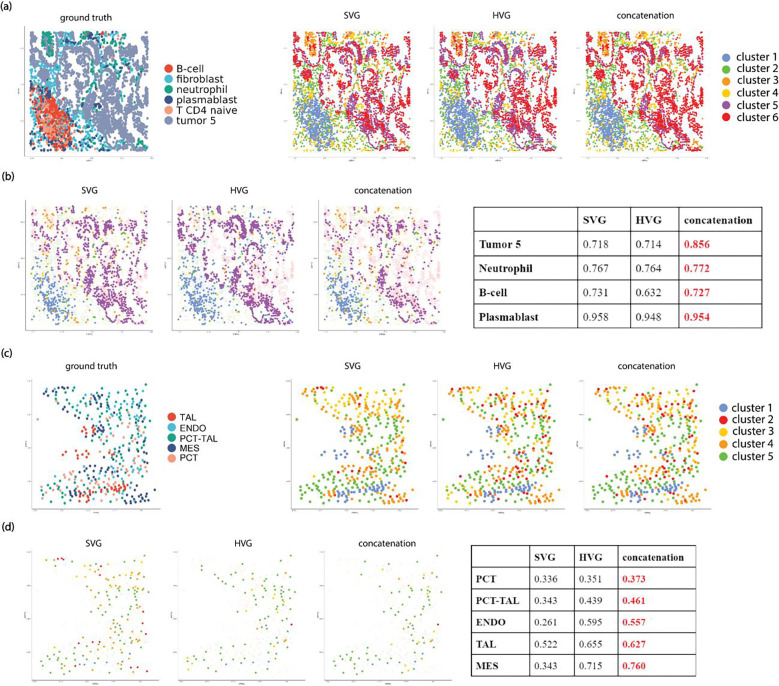
Figure 6.
Comparison of cluster performance of SV genes, HV genes, and their union set for Leiden for representative datasets. (a) comparison of clustering labels for cosMx NSCLC dataset for patient 2 FOV 7. (b) comparison of tissue space highlighting mis-classified clusters for each gene set in cosMx NSCLC dataset for patient 2 FOV 7, with cluster-specific spatial AMI scores for each gene set summarized in a table. (c) comparison of clustering labels for Xenium Kidney dataset sample N7. (d) comparison of tissue space highlighting mis-classified clusters for each gene set in Xenium Kidney dataset sample N7, with cluster-specific spatial AMI scores for each gene set summarized in a table. Annotation: TAL: thick ascending limb; ENDO: endothelial cells; PCT-TAL: proximal convoluted tube – thick ascending limb; MES: mesangial cell; PCT: proximal convoluted tube.

