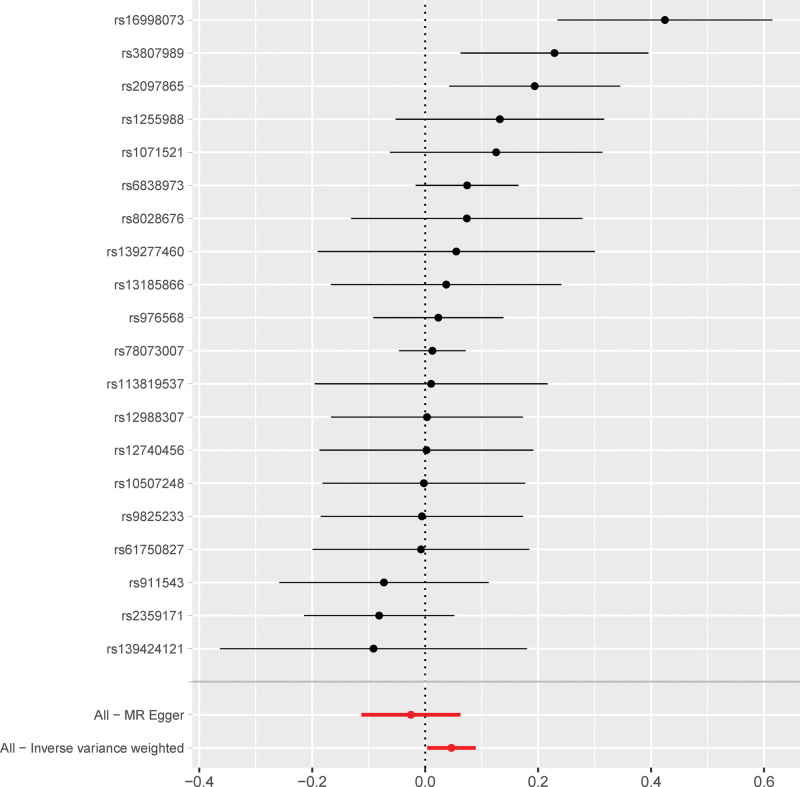
Figure 7.
Forest plot shows the causal effects of AF-related SNPs on MI. The black lines represent the effect sizes of the AF-related SNPs. The red lines at the bottom of the plot represent the combined significance MR results for the AF-related SNPs from the MR-Egger test and the IVW method. AF = atrial fibrillation, IVW = inverse-variance weighted, MI = myocardial infarction, MR = Mendelian randomization, SNPs = single nucleotide polymorphisms.

