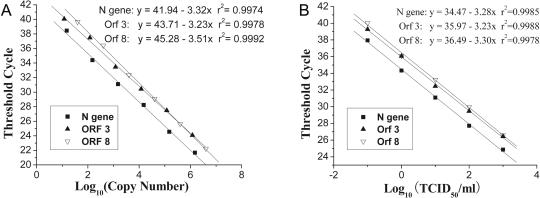
FIG. 1.
Standard curves generated for the N gene, ORF 3, and ORF 8. (A) Standard curves generated from the RNA transcripts of the N gene, and ORF 8. Each curve was based on the average of nine replicates. (B) Standard curves generated from the RNA extracted from 10-fold serially diluted live virus. Each curve is based on the average of three replicates.

