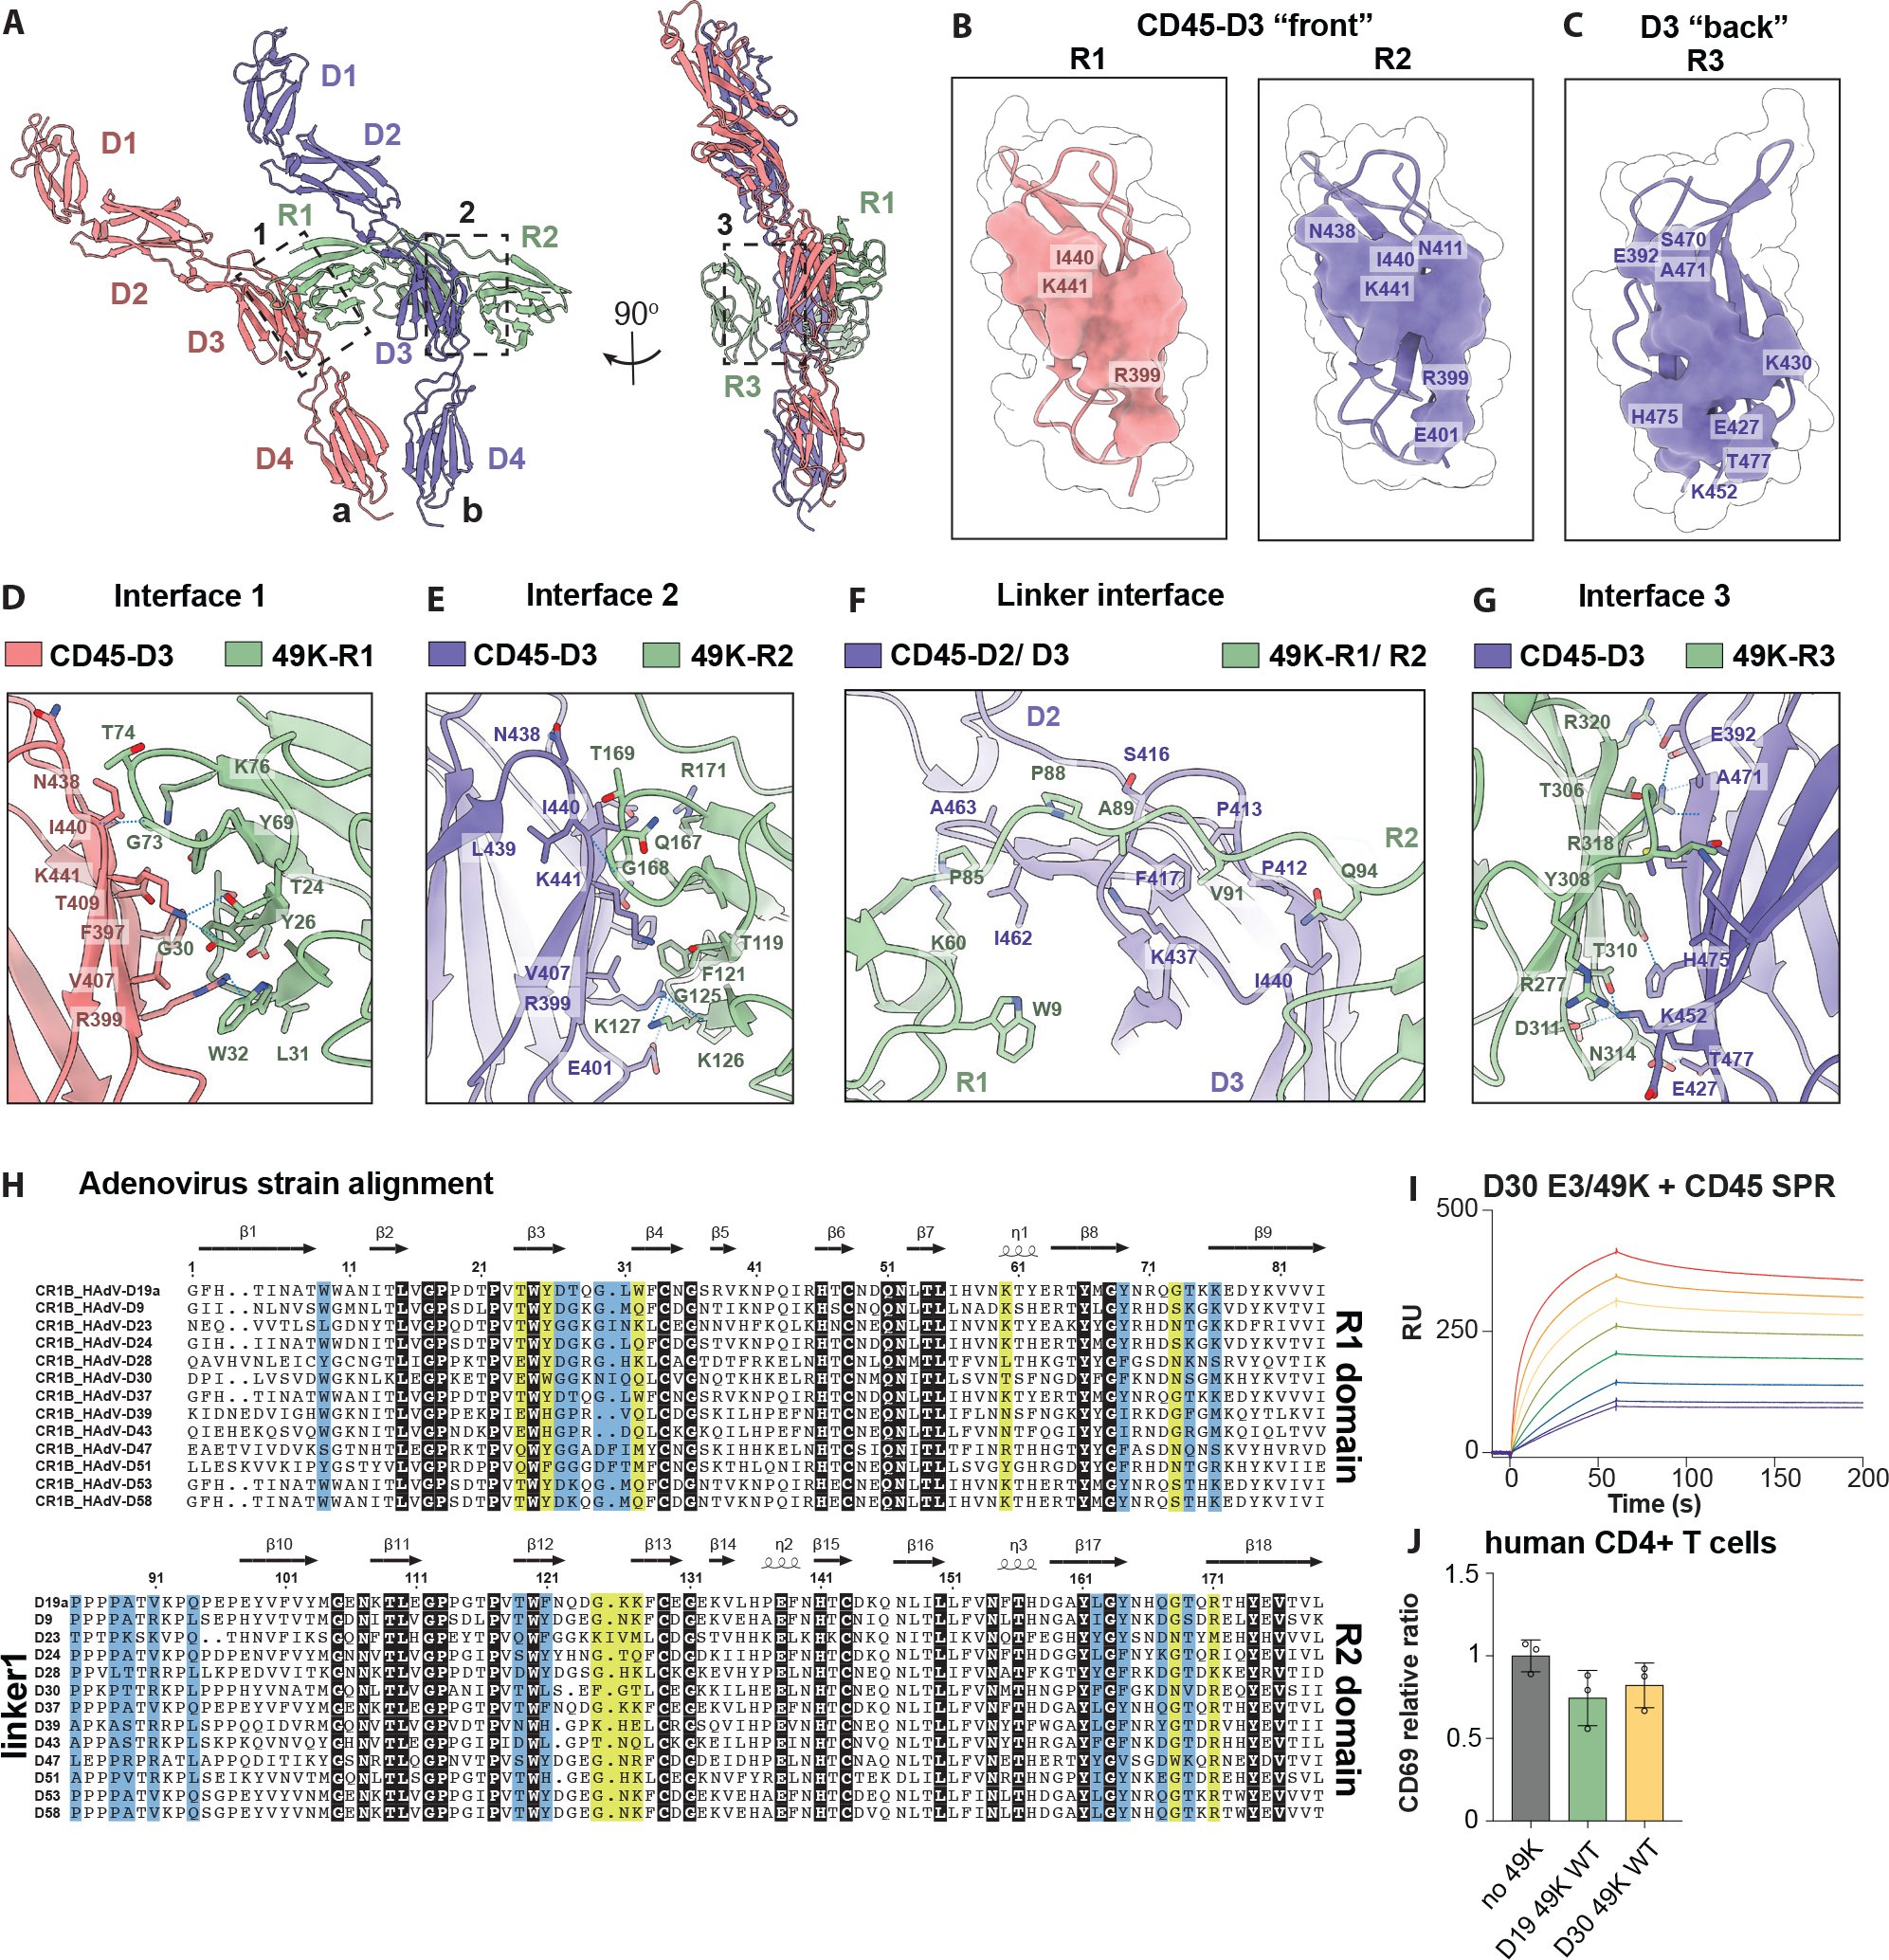
Fig. 2. Structural basis for CD45 engagement by viral E3/49K.

(A) Ribbon diagram of the 2:1 CD45:E3/49K complex. Dashed boxes indicate magnified interface views in later panels. (B) Binding footprint of E3/49K R1 (left) and -R2 (right) to the front of CD45 D3. (C) Binding footprint of E3/49K-R3 to the back of CD45-D3. (D) Interface 1 view of CD45-D3 and E3/49K R1. (E) Interface 2 view of CD45-D3 and E3/49K R2. (F) Interface view of CD45-D3 and linker between E3/49K R1-R2. (G) Interface 3 view of CD45-D3 and E3/49K R3. (H) Amino acid sequence alignment of E3/49K R1, linker and R2 between different D strains of adenovirus using Jalview (2.11.0). Highlighted residues are conserved (black), H-bond contacts (yellow) or vdW contacts (light blue). Arrows and helices indicate secondary structures. (I) SPR plot of CD45 and E3/49K strain D30. (J) CD69 expression upon incubating with E3/49K strain D30 compared with D19a, then stimulating with OKT3.
