Figure 3.

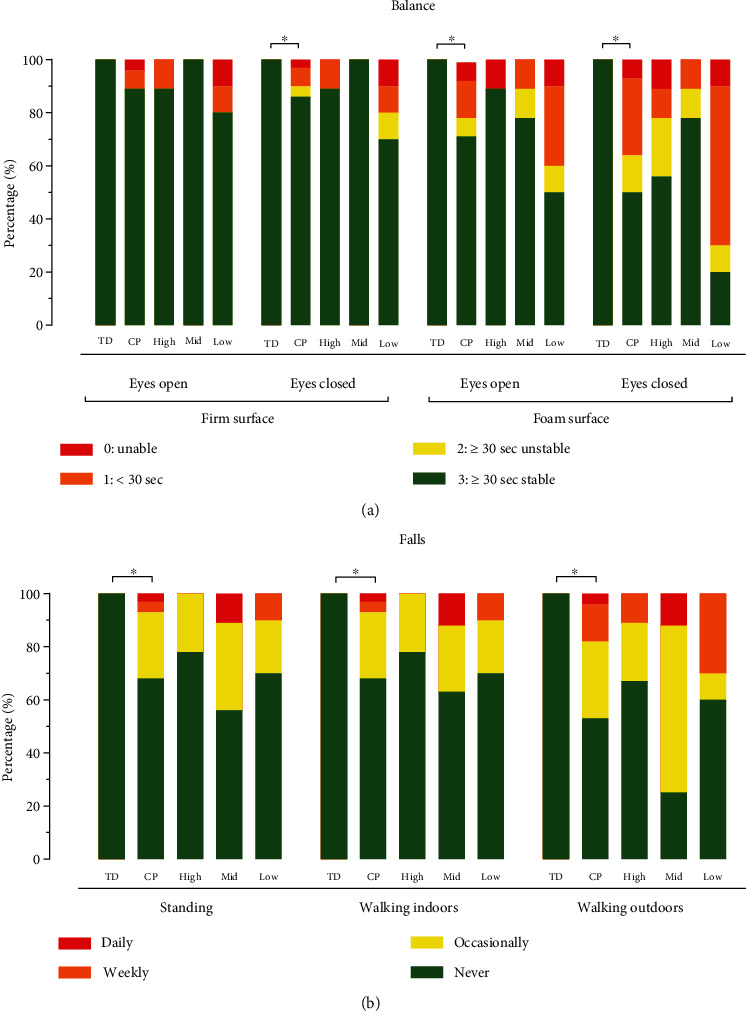
Stacked bar graphs of (a) CTSIB test and (b) falls of TD adults and adults with CP (as a group and per low, mid (middle), and high SES category). ∗Significantly different.

Stacked bar graphs of (a) CTSIB test and (b) falls of TD adults and adults with CP (as a group and per low, mid (middle), and high SES category). ∗Significantly different.