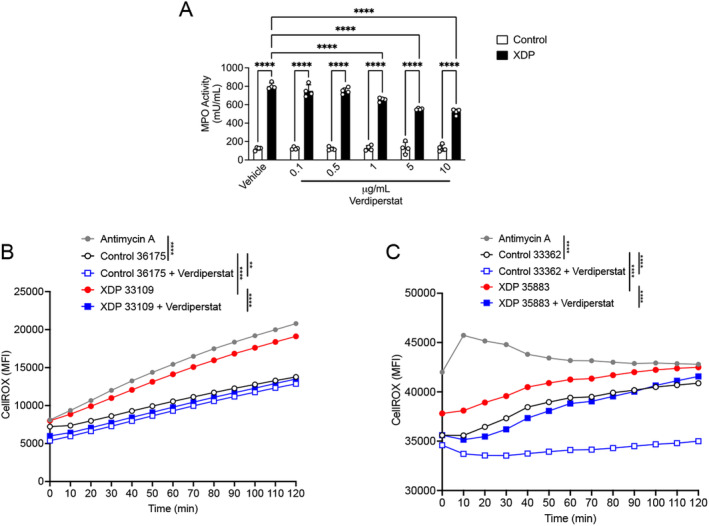
FIGURE 5.

Verdiperstat decreased MPO activity and ROS levels in XDP fibroblasts. (A) Two‐way ANOVA revealed a significant effect of treatment ([F (5, 36) = 20.08], p < 0.0001), genotype ([F (1, 36) = 2890], p < 0.0001), and treatment × XDP interaction ([F (5, 36) = 22.71], p < 0.0001) on MPO activity in fibroblasts. Tukey's' test demonstrated a significant increase in MPO activity in XDP‐ compared with control‐derived fibroblasts (p < 0.0001) as well as a significant increase in MPO activity in XDP‐derived fibroblasts treated with either 0.1 (p < 0.0001), 0.5 (p < 0.0001), 1 (p < 0.0001), 5 (p < 0.0001), or 10 μg/mL of verdiperstat (p < 0.0001) compared with control‐derived fibroblasts treated with the same doses of verdiperstat. Lastly, Tukey's test revealed a significant decrease in MPO activity in XDP‐derived fibroblasts treated with either 5 (p < 0.0001) or 10 μg/mL of verdiperstat (p < 0.0001) compared with vehicle‐treated XDP‐derived fibroblasts. Bar graph represents the average MPO activity measured in two different XDP fibroblast lines (33109 and 35883) and two different control fibroblasts (36175 and 33362). (B) Two‐way ANOVA revealed a significant effect of genotype ([F (4, 48) = 120.3], p < 0.001), and time ([F (12, 48) = 61.32], p < 0.0001) on ROS levels in fibroblasts. Tukey's test revealed an expected significant increase in ROS in antimycin A‐treated fibroblasts compared to vehicle‐treated control fibroblasts (p < 0.0001). There was also a significant with in ROS in XDP fibroblasts compared to control fibroblasts (p < 0.0001). Importantly, Tukey's test demonstrated a significant decrease in ROS in both control‐ and XDP‐derived fibroblasts treated with verdiperstat compared with vehicle‐treated control (p = 0.052) and XDP fibroblasts (p < 0.0001). (C) Two‐way ANOVA demonstrated a significant effect of genotype ([F (4, 48) = 91.45], p < 0.0001), and time ([F (12, 48) = 3.579], p = 0.0008) on ROS levels in a second set of fibroblasts. As expected, there was a significant increase in antimycin A‐treated fibroblasts compared with vehicle‐treated control fibroblasts (p < 0.0001). Furthermore, Tukey's test demonstrated a significant increase in ROS in XDP fibroblasts compared with control fibroblasts (p = 0.0025). Importantly, Tukey's test revealed a significant decrease in ROS levels in both control‐ and XDP‐derived fibroblasts treated with verdiperstat compared with vehicle‐treated control (p < 0.0001) and XDP fibroblasts (p = 0.0002). **p < 0.001; ****p < 0.0001.
