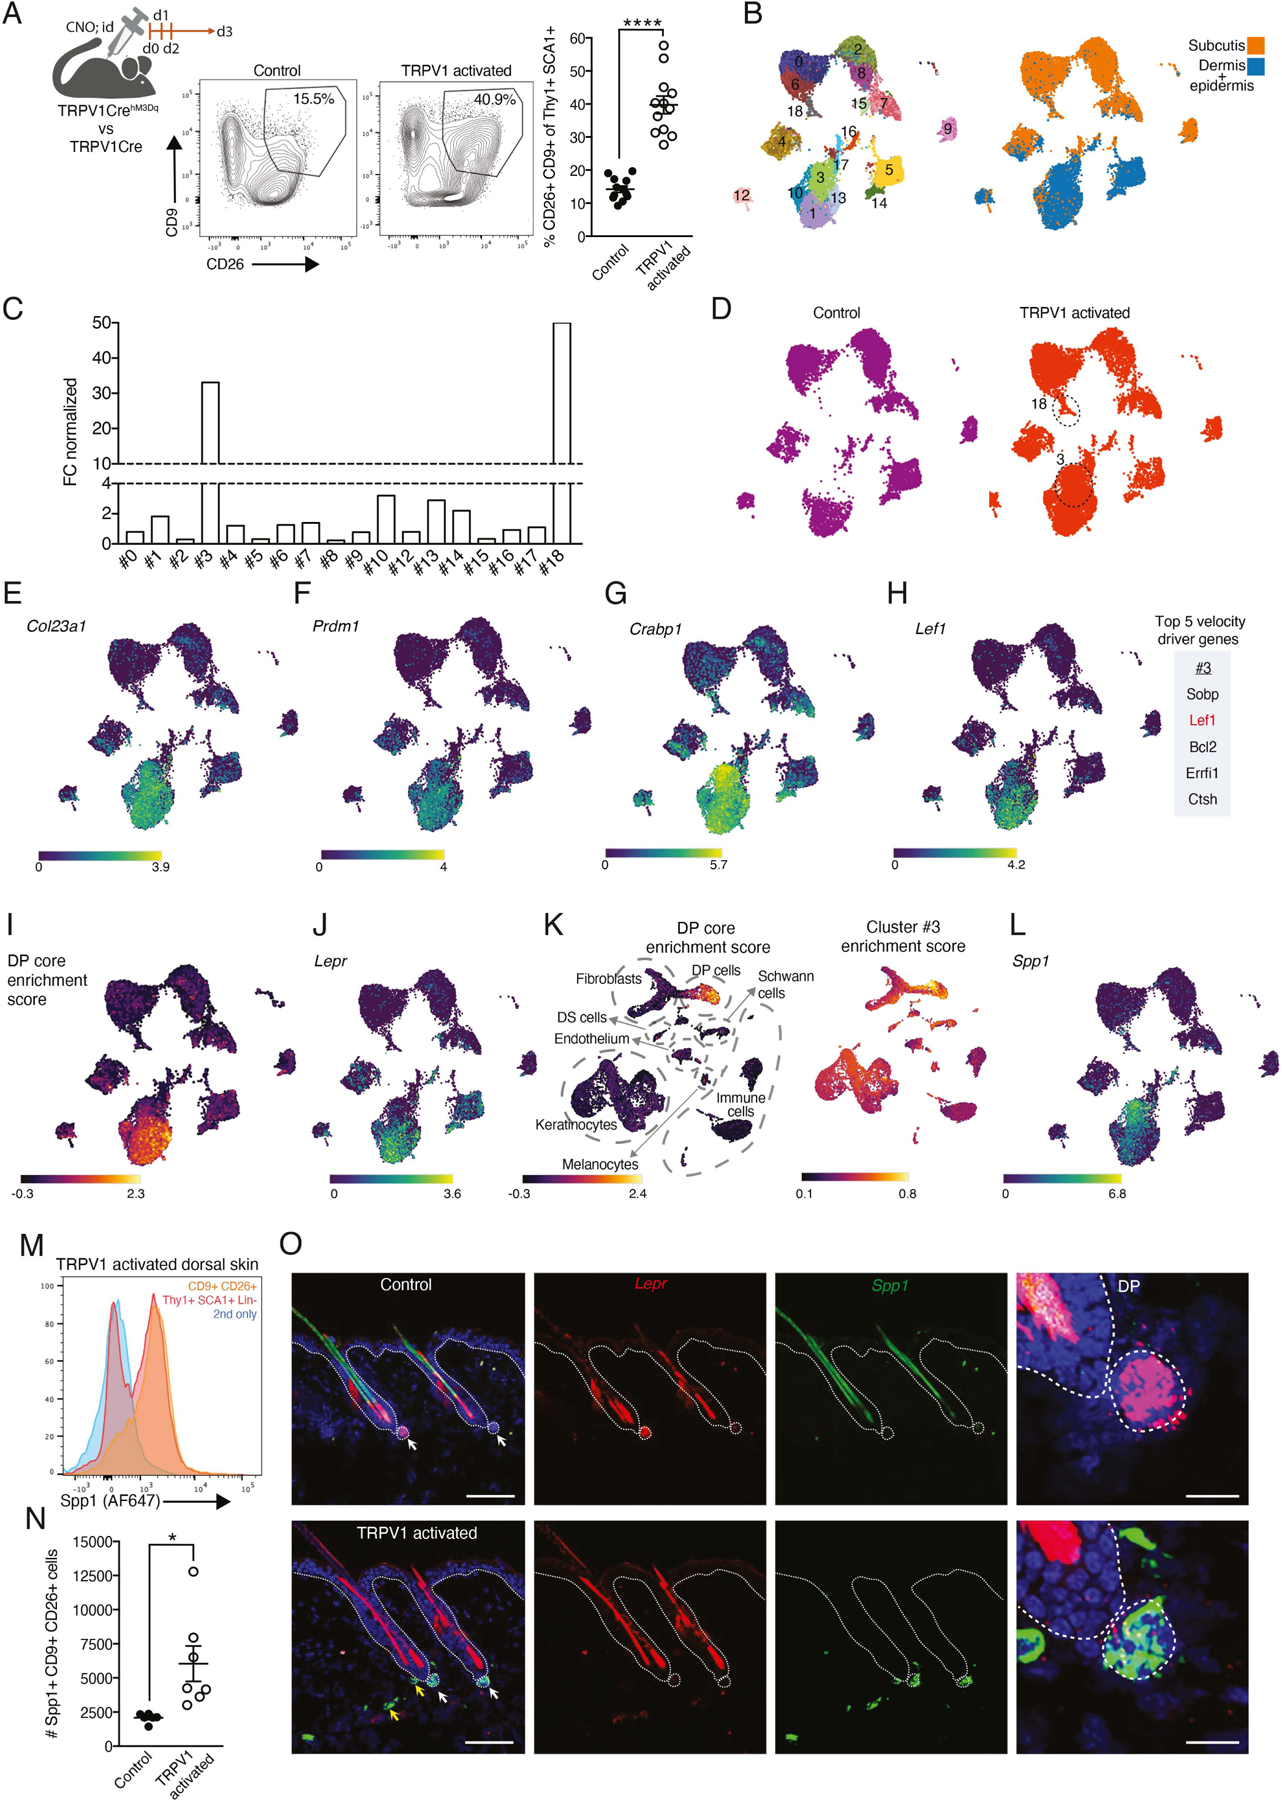
Figure 1: Repeated cutaneous TRPV1 activation triggered changes in dermal fibroblast gene expression.

(A) Diagram of experimental design, representative FACS plots and quantification of CD9+CD26+ dermal fibroblasts percentage from Lin- Thy1+SCA1+ dorsal skin cells after three daily CNO intradermal injections from TRPV1 activated mice and their controls (****p<0.0001).
(B) UMAP projection demonstrating the clustering of sorted Thy1+SCA1+ fibroblasts based on scRNAseq data, and the overlay of the Hashtag signal differentiating the subcutis and dermal clusters.
(C) Normalized fold change (FC) calculation comparing cell numbers in dermal clusters between TRPV1 activated mice and their controls.
(D) UMAP projection of sorted fibroblast scRNAseq data demonstrating cell distribution between clusters in the TRPV1 activated sample and control.
(E-H) UMAP projection of sorted fibroblasts demonstrating the expression of (E) Col23A1 (F) Prdm1 (G) Crabp1 and (H) Lef1 as well as the list of top five velocity driver genes for cluster #3.
(I) UMAP projection demonstrating calculated DP-core enrichment score and (J) Lepr expression.
(K) UMAP projection of scRNASeq from Li et al.41 demonstrating its calculated DP-score (left) and cluster #3 enrichment score (right).
(L) UMAP projection of sorted fibroblasts demonstrating the expression of Spp1.
(M) Representative FACS histograms of anti-Spp1 staining of Lin- Thy1+SCA-1+ dermal cells (red) or CD9+CD26+ subset (orange) from the back skin of TRPV1 activated mouse. Secondary only staining control in blue.
(N) Quantification of Spp1+CD9+CD26+ dermal fibroblasts from TRPV1 activated mice and controls (*p=0.017).
(O) Representative images of RNAscope staining for Spp1 (green) and the Lepr (red) on dorsal skin collected from TRPV1 activated mice and controls. Scale bar, 100um. White arrows point out DP; yellow arrows point out Spp1 expression out of DP. DP images scale bar, 25um.
