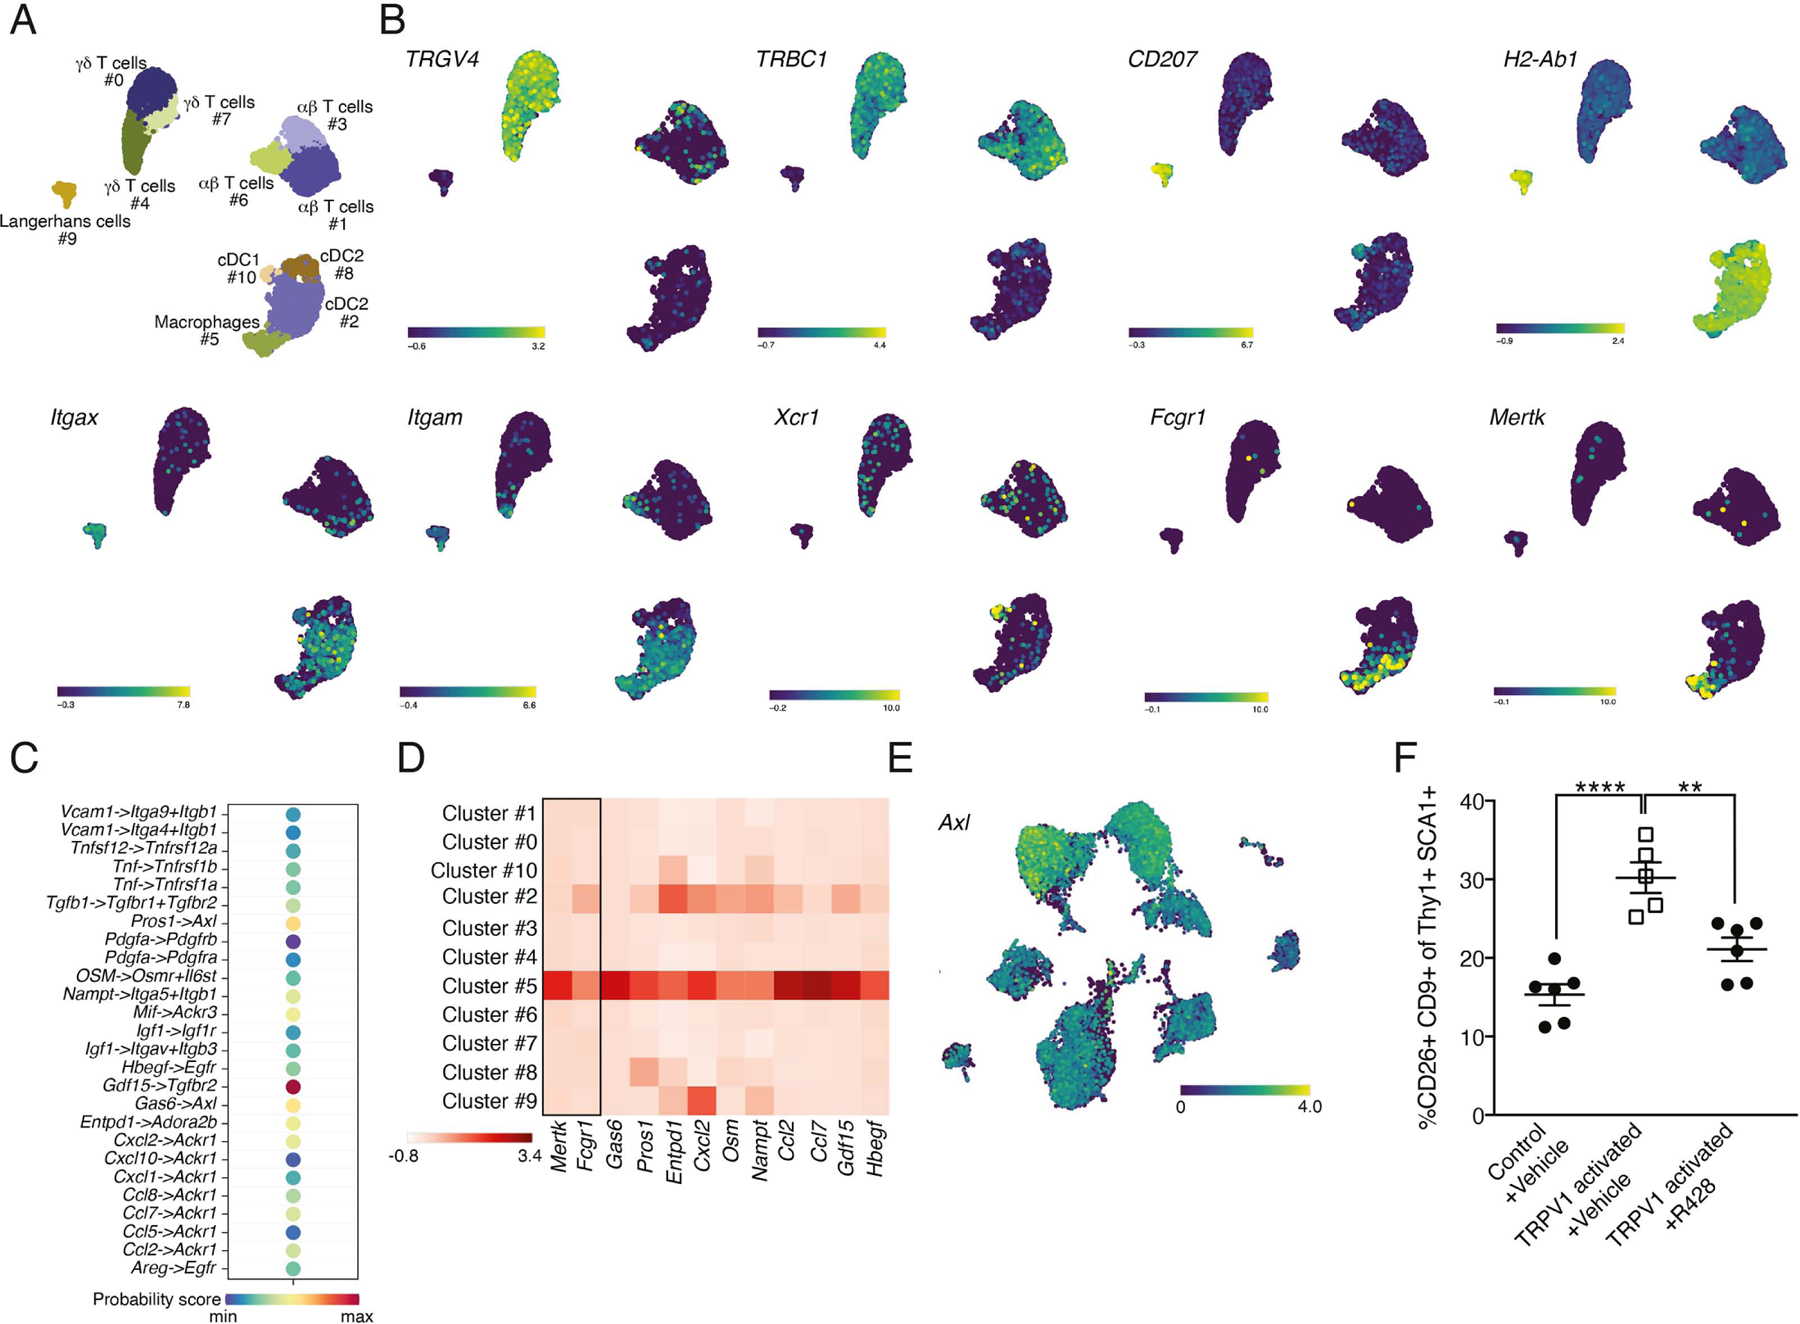
Figure 5: Dermal macrophage gene expression analysis and role for Axl signaling in effects of TRPV1 neuronal activation on fibroblasts.

(A) UMAP projection demonstrating the clustering of sorted dermal CD45+ cells based of scRNAseq data.
(B) UMAP projection demonstrating the expression of TRGV4, TRBC1, CD207, H2-Ab2, Itgax, Itgam, Xcr1, Fcgr1 and Mertk.
(C) Visualization of CellChat data demonstrating potential interactions and their probability between cluster #5 of dermal macrophages and cluster #3 of dermal fibroblasts.
(D) Heat map visualization of gene expression for ligands identified by CellChat to have potential interactions with fibroblasts (x-axis) across all clusters (y-axis). Rectangle separates macrophage defining markers (Mertk and Fcgr1). Color encodes average gene expression.
(E) UMAP projection of sorted fibroblasts demonstrating the expression of Axl.
(F) Percentage of dermal CD26+CD9+ fibroblasts from TRPV1 activated and control mice pretreated with R428 or vehicle (**p=0.004,****p<0.0001).
