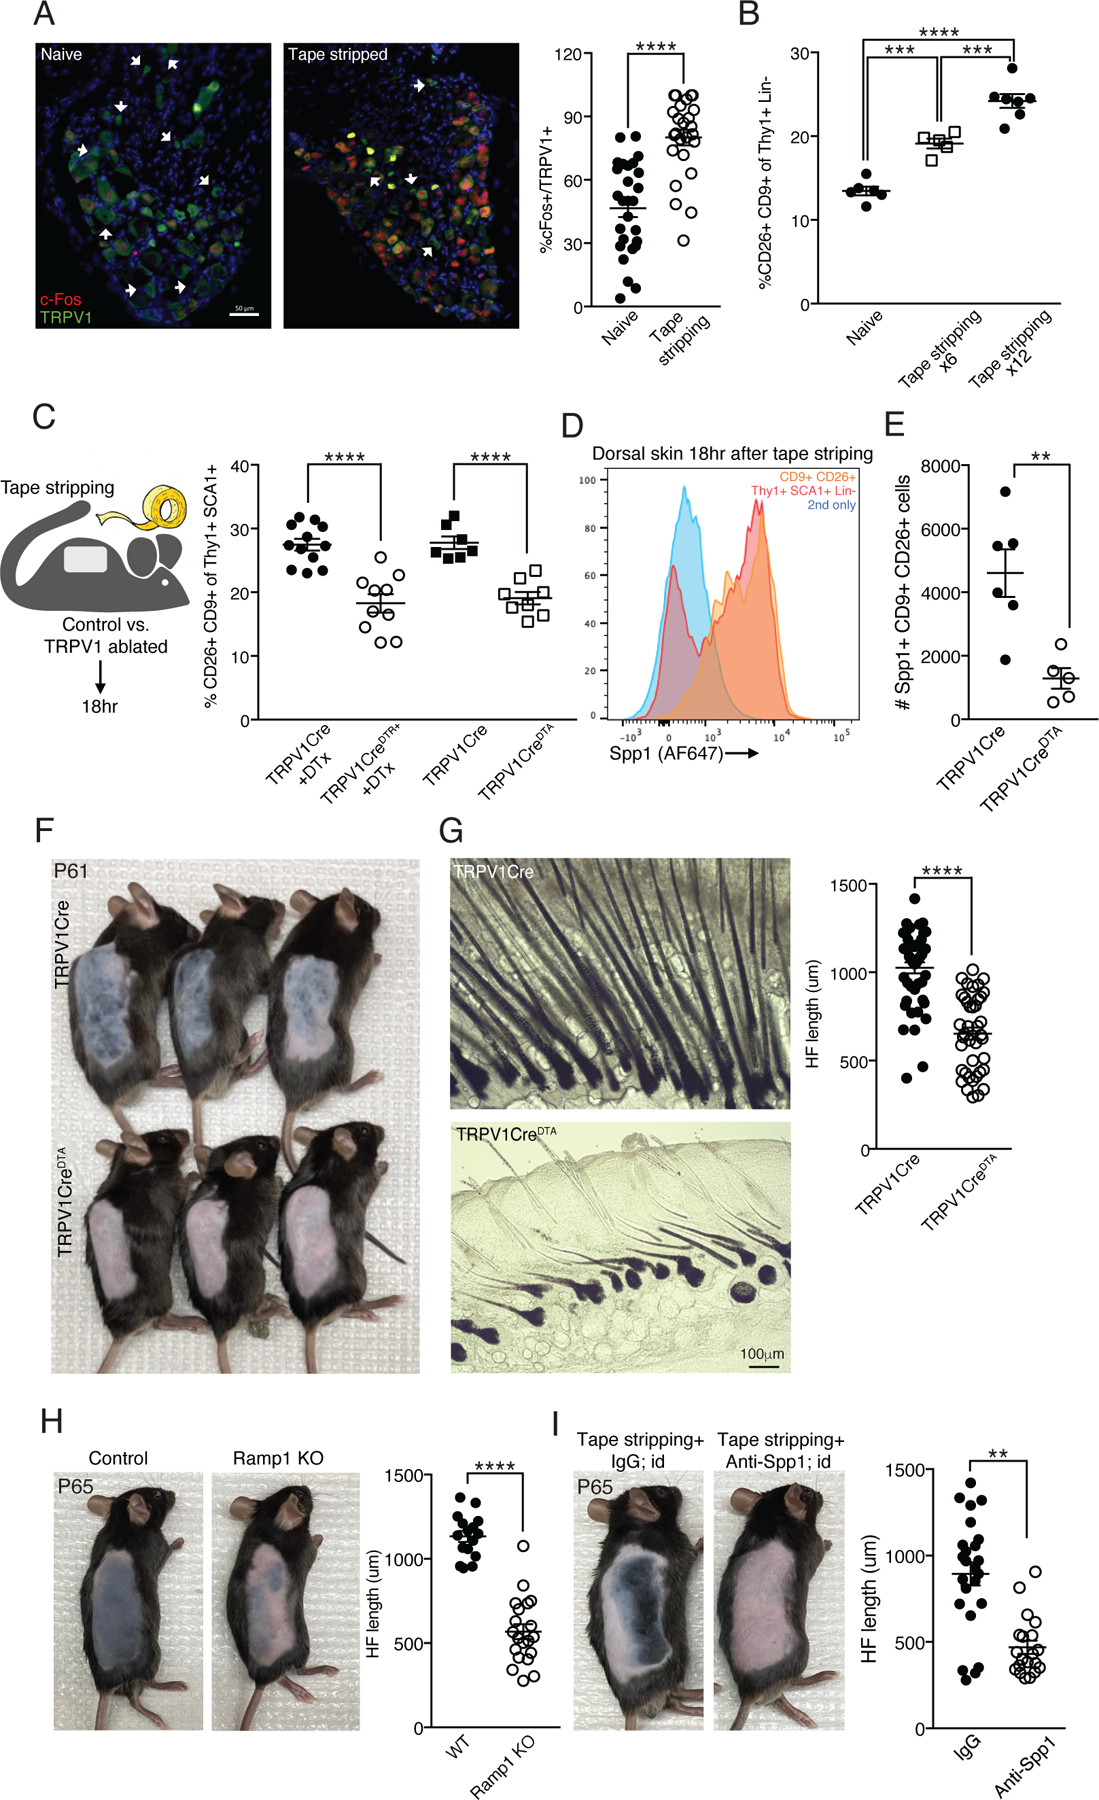
Figure 6: TRPV1 neuronal ablation affects dermal fibroblast reaction to tape stripping and attenuates post-wounding HF regeneration.

(A) Representative immunofluorescent images and quantification of DRGs collected from mice with naïve back skin or 90 minutes after tape stripping. Stained with anti-c-Fos (red), anti-TRPV1 (green) and DAPI (blue). White arrowheads indicate neuron cell bodies that are TRPV1+ only. Data combined from 6–7 fields of view taken from 4 mice per group (****p<0.0001). Scale bar 50μm.
(B) Percentage of CD9+CD26+ dermal fibroblasts from naïve back skin and 18 hours after tape stripping 6 or 12 times (***p=0.0004,****p<0.0001).
(C) Diagram of experimental design and quantification of CD9+CD26+ dermal cell percentage 18 hours after tape stripping from the back skin of TRPV1CreDTR+ treated with DTx or TRPV1CreDTA+ mice and their controls (****p<0.0001).
(D) Representative FACS histogram of anti-Spp1 staining. Dorsal skin treated as in C and gated on total Lin- Thy1+SCA-1+ cells (red) and the CD9+CD26+ cell subset (orange). Secondary only staining control in blue.
(E) Quantification of Spp1+CD9+CD26+ dermal fibroblasts from TRPV1 ablated and control mice treated as in C (**p=0.005).
(F) TRPV1 ablated mice and controls treated as in C and monitored for hair coat recovery for 12 days (postnatal day 61).
(G) Representative bright field images of samples described in F. Data for HF length quantification collected from 8 HFs per mouse taken from 6 control and 5 TRPV1 ablated mice (****p<0.0001).
(H) Ramp1 KO mice and controls treated as in F. HF length quantification from 4 HFs per mouse taken from 4 control and 5 Ramp1 KO mice (****p<0.0001).
(I) Mice treated as in F and intradermally injected with anti-Spp1 or isotype control while being monitored for hair coat recovery for 16 days (postnatal day 65). HF length quantification from 4 HFs per mouse taken from 6 isotype control and 5 anti-Spp1 injected mice (**p=0.005).
