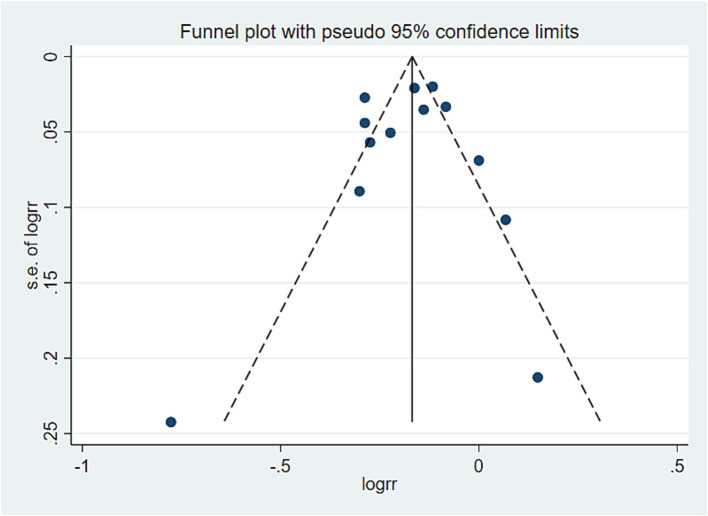
Figure 5.
PDI and all-cause mortality offset analysis data. Visual observation was used to identify the presence of publication bias. If the funnel plot shows that the majority of studies are located at the top of the “funnel” with fewer at the base and that there is approximate symmetry on both sides, it suggests that publication bias is not significant. Conversely, if there is an obvious asymmetry, it indicates a clear publication bias.

