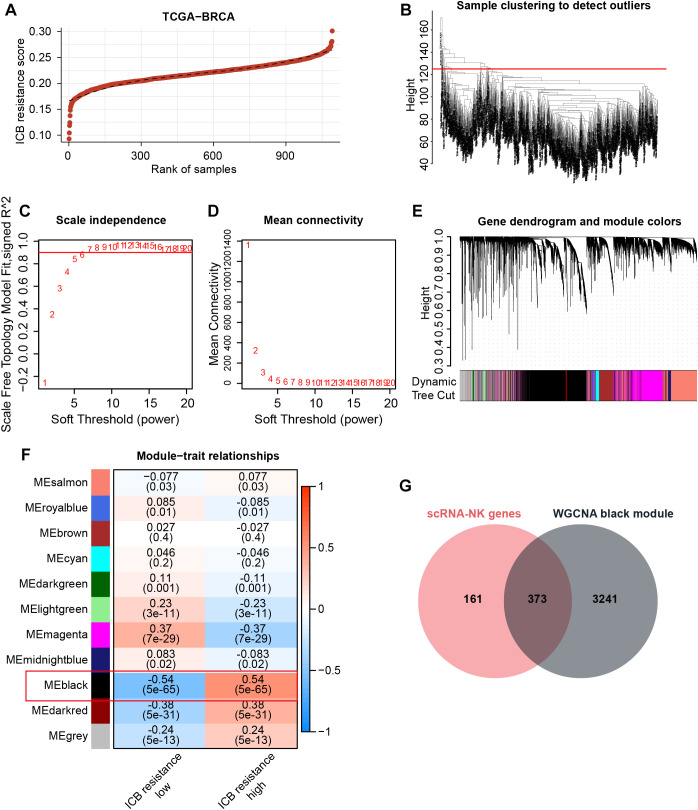
Figure 3.
Identification of ICB resistance-related modules through WGCNA. (A) ICB resistance scores of samples in the TCGA-BRCA cohort. (B) The outlier samples were removed from the analysis. (C, D) The optimal soft-thresholding power was determined to be 6. (E) A dynamic tree cut was visualized. (F) Correlation analysis between modules and traits. (G) The Venn diagram demonstrates the intersection of NK marker genes and ICB resistance-related genes.

