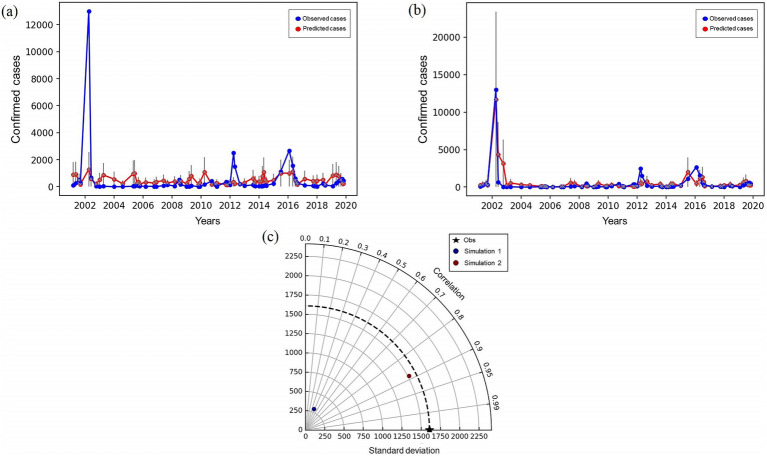
Figure 11.
Regression analysis forecasts and results of monthly dengue cases for Recife from 2001 to 2019. (a) Simulation 1 considering as independent variables insolation, precipitation, temperature, days of precipitation, pressure and relative humidity. (b) Simulation 2 considering the same variables as the previous round with the addition of the percentage of DENV-1, DENV-2, DENV-3, and DENV-4 serotypes; (c) Taylor diagram of the time series generated from simulations 1 and 2 compared with observed data.

