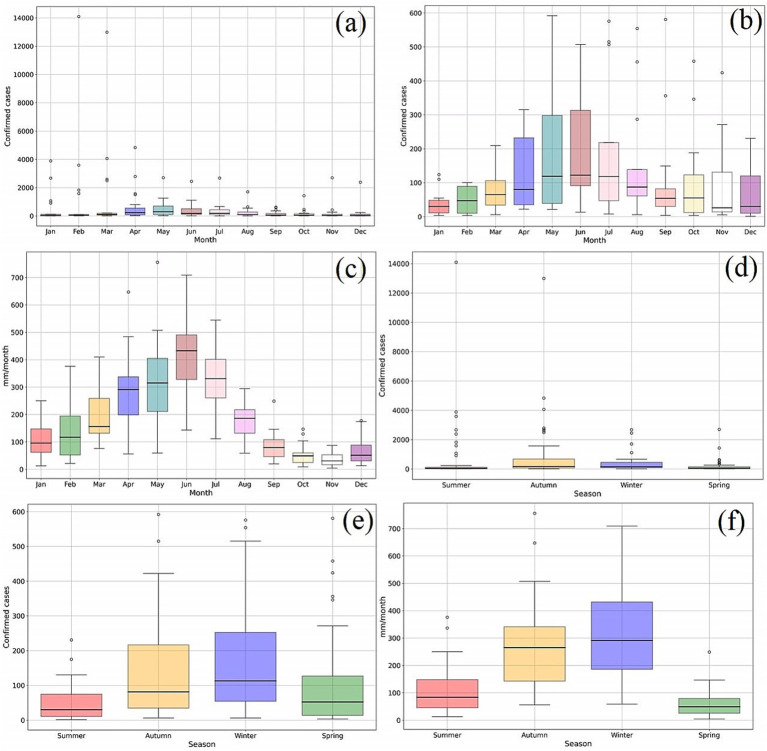
Figure 6.
Box diagrams of the time series of dengue and precipitation in Recife from 2001 to 2019 and with the mean calculated after removing the epidemiological years of 2002, 2008, 2010, 2012, 2015, and 2016. (a) Monthly mean of confirmed dengue cases from 2001 to 2019; (b) Monthly mean of confirmed dengue cases without epidemiological years; (c) Monthly mean of precipitation from 2001 to 2019; (d) Seasonal mean of confirmed dengue cases from 2001 to 2019; (e) Seasonal mean of confirmed dengue cases without epidemiological years; (f) Seasonal mean of precipitation from 2001 to 2019.

