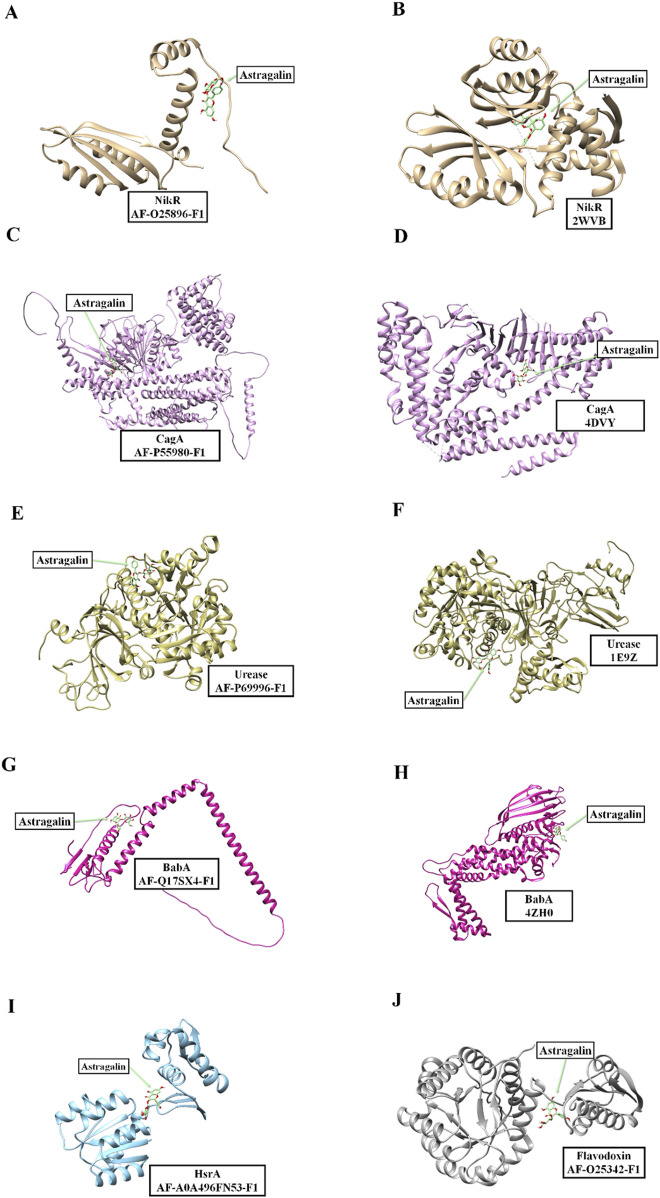
FIGURE 6.
Visualizations of the molecular interactions between H. pylori proteins and astragalin. Detailed representations of the interactions between astragalin ligand and various Helicobacter pylori proteins. The structures are derived both from crystal data from the Protein Data Bank and from models predicted by the AlphaFold platform. The images specifically illustrate astragalin’s interactions with: NikR Panels (A, B), CagA Panels (C, D), Urease Panels (E, F), BabA Panels (G, H), HsrA Panel (I), Flavodoxin Panel (J). The proteins are coloured according to their structural representation, highlighting the regions of interaction with astragalin ligand, marked in green.

