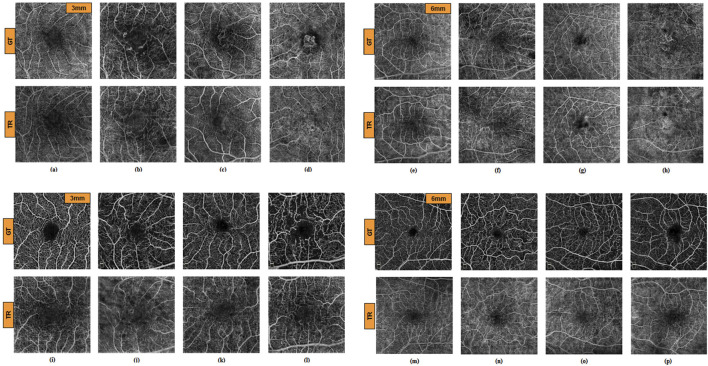
FIGURE 3.
GT and TR-OCTA images for NORMAL (A, E), DR (B, F), CNV (C, G) and AMD (D, H) patients from OCT500. (A–D) images are of 3 mm and (E–H) are of 6 mm. Similarly (I–P) are OCTA images from UIC dataset. (I, M) from Control, (J, N) from Mild, (K, O) from Moderate and (L, P) from Severe group for 3 mm and 6 mm respectively.

