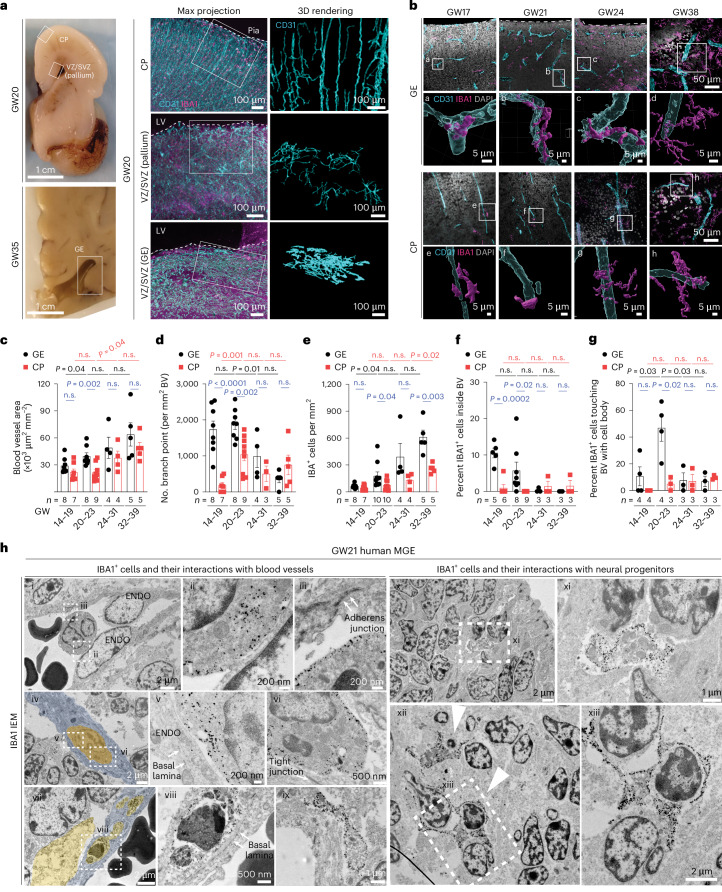
Fig. 1. Macrophages/microglia interact with nascent vasculature in the second trimester human brain.
a, Left: coronal sections of prenatal human brain at GW20 and GW35, highlighting the GEs, VZ/SVZ of the pallium and cortical plate (CP). Middle: the light-sheet images in optically cleared coronal sections show the intricate interactions between IBA1+ cells and CD31+ endothelial cells in CP, VZ/SVZ of pallium and GEs. Right: IMARIS 3D images reveal the morphology of CD31+ endothelial cells in each brain region. LV, lateral ventricle. b, Confocal images and IMARIS 3D rendering of IBA1+ cells interacting with CD31+ endothelial cells in the GE and CP at GW17, GW21, GW24 and GW38. Images highlighted by white boxes are enlarged and represented in IMARIS 3D images in panels below (white letters a–h). c,d, Quantification of blood vessel and vascular branch point densities in the GE and CP in the prenatal human brain. e–g, Quantification of the density of IBA1+ cells, the percentage of IBA1+ cells inside blood vessels and the percentage of extravascular IBA1+ cells touching blood vessels with cell body in the GE and CP. h, IEM using the IBA1 antibody shows macrophages and microglia inside blood vessels with primitive basal lamina and in the perivascular milieu in the MGE of prenatal human brain at GW21. The arrows in (iii) indicate primitive adherens junction in endothelial cells, and the arrowheads in (xii) indicate IBA1+microglia engulfing neuroblasts. The images in h are from one GW21 prenatal human brain. ENDO, endothelial cell. The same experiments were performed in another second trimester case at GW17 with the similar results. Statistics in c–g use a two-tailed, unpaired Student’s t-test, and the data represent the mean ± standard error of the mean. n.s., not significant. n indicates the number of independent biological samples used for quantification.

