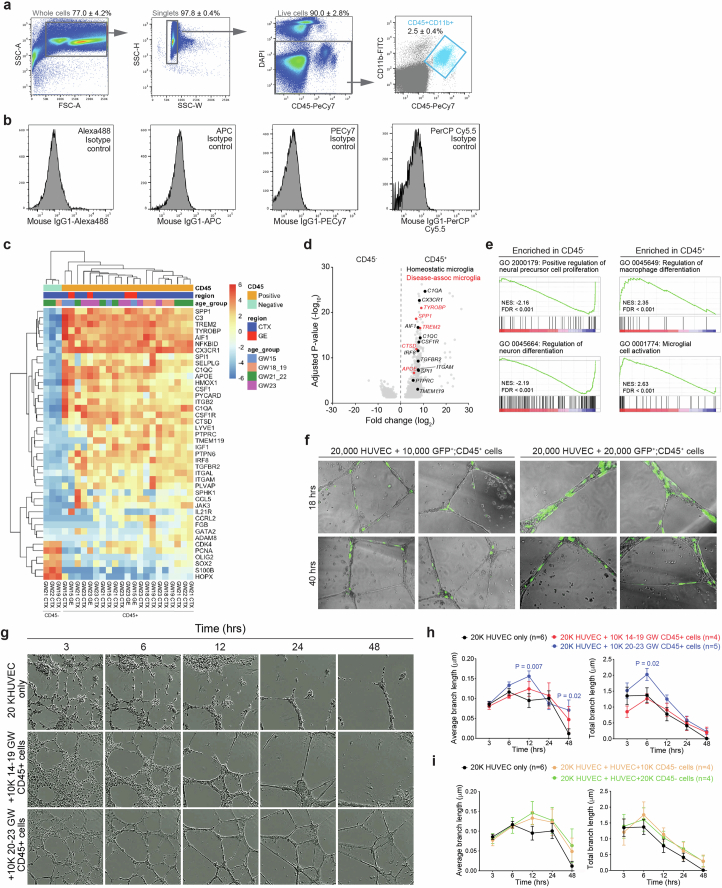
Extended Data Fig. 4. Stage-dependent role of human CD45+ immune cells in promoting vascular morphogenesis.
(a) Fluorescence-activated cell sorting (FACS) gating strategy to select for CD45+;CD11b+ cells. (b) Isotype controls used in FACS. (c) Heatmap of critical differentially expressed genes in CD45− and CD45+ cells used in bulk RNA-seq. (d) Volcano plot shows the genes enriched in CD45+ cells (right). Genes shown were filtered to be below adjusted p-value of 0.05 and above fold change of 1.2 between CD45− and CD45+ cells. (e) Gene set enrichment analysis (GSEA) reveals gene ontology (GO) terms enriched in CD45− and CD45+ cells. Data from panels c-e are from 3 independent biological samples of CD45− cells, and 21 independent biological samples of CD45+ cells. (f) Images taken from InCucyte S3 Live Imaging Device of HUVEC and AAV-CMV-GFP transfected CD45+ cells from prenatal human brain samples at 18 and 40 hrs after plating. (g) Images taken from InCucyte S3 Live Imaging Device of HUVEC at 3, 6, 12, 24 and 48 hrs after plating. The conditions include 20,000 HUVEC alone, and 20,000 HUVEC co-cultured with 10,000 GW14-19 or GW20-23 CD45+ cells from prenatal human brain. (h, i) Quantification of average and total endothelial branch lengths formed by HUVEC that are co-cultured with CD45+ cells (h) or CD45− cells (i). Statistics in panels h and i use two-tailed, unpaired Student’s t-test, data represent mean ± SEM. The P values represent comparisons between HUVECs co-incubated with CD45+ cells vs HUVECs only. Not significant comparisons are not shown. n indicates the number of independent biological samples used for quantification.

