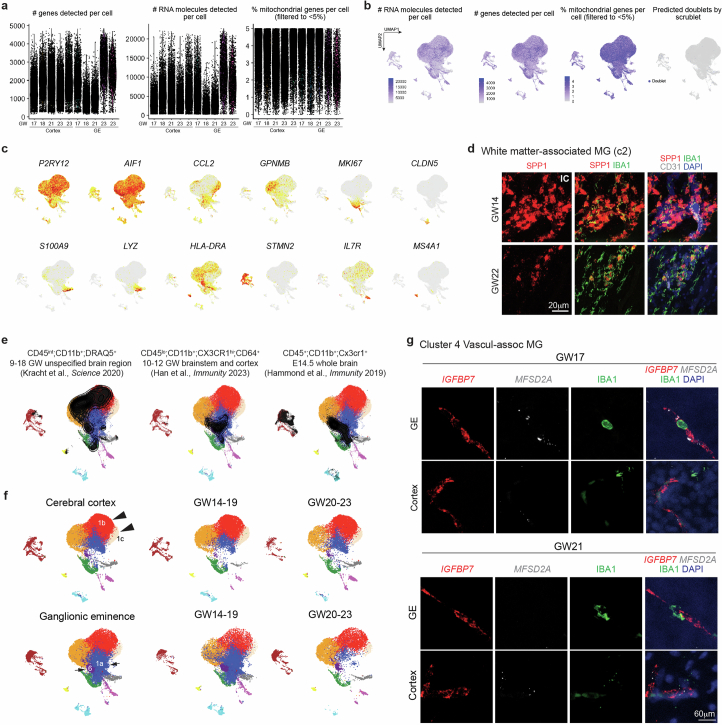
Extended Data Fig. 5. Single-cell transcriptomics reveal subtypes of CD45+ cells and their regional specificity.
(a-b) Quantifications of the number of genes, RNA molecules, and percentage of mitochondrial genes per cell, as well as predicted doublets from scRNA-seq. Each dot represents one cell. (c) UMAP feature plots of marker gene expressions that define each subtype of CD45+ cells. (d) Confocal images of white matter-associated microglia marker SPP1 (RNAscope probe) in IBA1+ cells in the internal capsule (IC) of GW14 and GW22 human brains. (e) Projection of published scRNA-seq datasets of microglia in prenatal human and mouse brain onto the UMAP plot of our scRNA-seq. (f) UMAP plots show differences in the clustering of CD45+ cell subtypes from the cerebral cortex at GW14-19 and GW20-23 (arrowheads), and the clustering of CD45+ cell subtypes from the ganglionic eminences at GW14-19 and GW20-23 (arrows). Data from panels a-c, e, and f are from 5 independent biological samples. (g) Confocal images of VAM markers IGFBP7 and MFSD2A (RNAscope probes) in IBA1+ cells in GE and cortex of GW17 and GW21 human brains. The experiments in panels d and g were repeated in three independent biological replicates.

