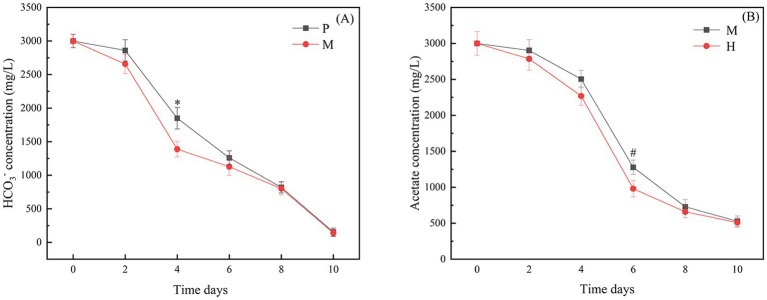
Figure 2.
(A) The rate of bicarbonate consumption in photoautotrophic and mixotrophic modes; (B) The rate of acetate consumption in heterotrophic and mixotrophic modes. “*” indicates that there is a significant difference between “P” and “M,” and “#” indicates that there is a significant difference between “H” and “M”(p < 0.05).

