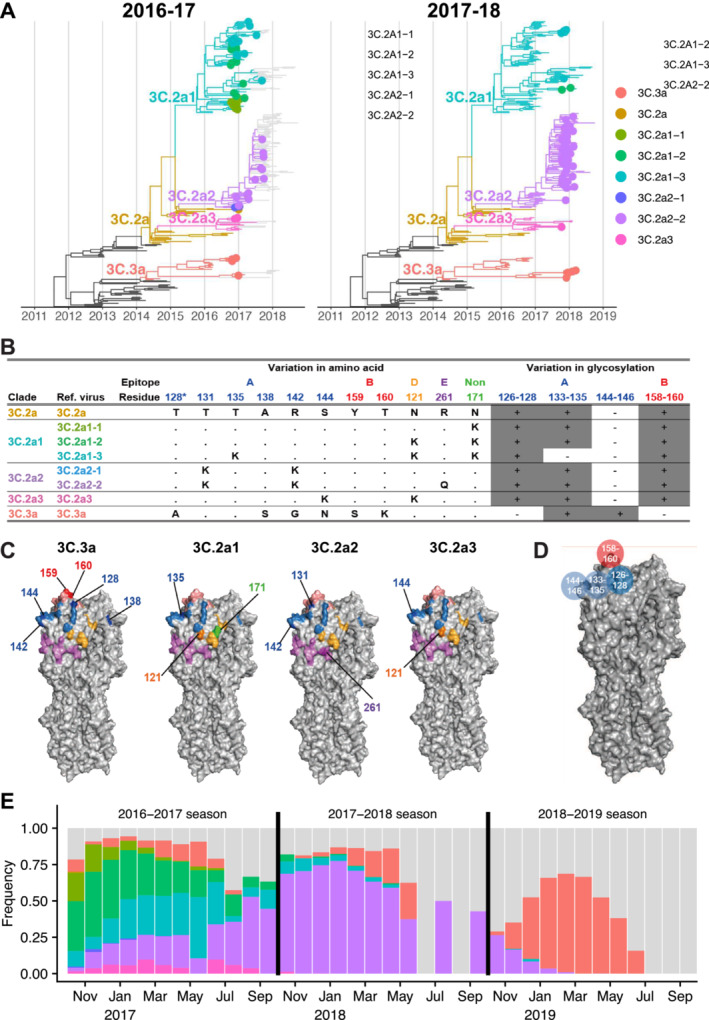
FIGURE 1.

Reference viruses representing co‐circulating H3N2 clades during the 2016–2017 season. (A) Genealogies of H3N2 HA through the 2016–2017 (left) and 2017–2018 season (right). Tips are colored by similarity to reference viruses. For clades with multiple representative viruses, branches are colored the same as one of those viruses, chosen arbitrarily. Tips are shown as filled circles if collected in North America during the most recent season. (B) Amino acid and glycosylation site variation among reference viruses. Clades 3C.3a and 3C.2a diverge at additional non‐epitope sites (not shown). Residue 128 belongs to antigenic site B, but the substitution T128A results in loss of glycosylation on residue 126 of epitope A. Therefore, we show residue 128 in epitope A and in the glycosylation site involving residues 126–128, following [20]. (C) Variable residues among the reference viruses are shown on the H3 structure of A/Aichi/2/1968 (Protein Data Bank: 1HGG) and colored by epitope as in panel (B). For each strain, residues differing from 3C.2a are numbered and darker in color. (D) Glycosylation sites used in the model shown on the H3 structure. (E) Monthly clade frequencies among GISAID isolates from North America collected between the 2016–2017 and the 2018–2019 seasons. Gray bars represent isolates that do not belong to the focal clades in this study.
