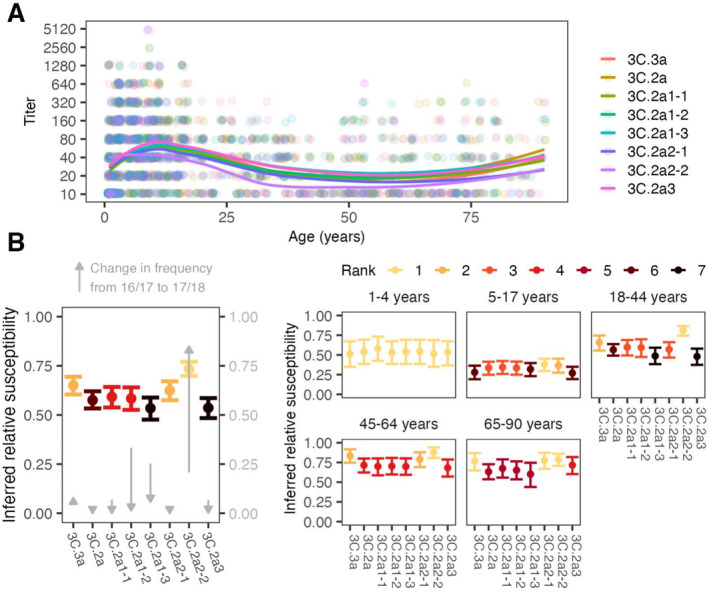
FIGURE 2.

Antibody titers and inferred relative susceptibilities to co‐circulating H3 strains show variability by strain and age group. (A) FRNT titers with points jittered slightly along the ‐ and ‐axes. Lines are locally estimated scatterplot smoothing (LOESS) curves of geometric mean titers (smoothing parameter , degree ). (B) Inferred relative susceptibility to each reference strain for the whole population (left) and by age group (right). The bars indicate 95% CIs obtained from bootstrapping. Separately for the overall population and each age group, we ranked strains in decreasing order of susceptibility using pairwise bootstrap tests (e.g., a strain had rank 1 if susceptibility to it was significantly higher than susceptibility to all other strains in pairwise tests, 2 if significantly higher for all but one strain, and so on. Strains are tied in rank and appear in the same color if their relative susceptibilities do not differ significantly. The gray arrows show how the clades changed in frequency in North America between the 2016/17 and 2017/2018 seasons.
