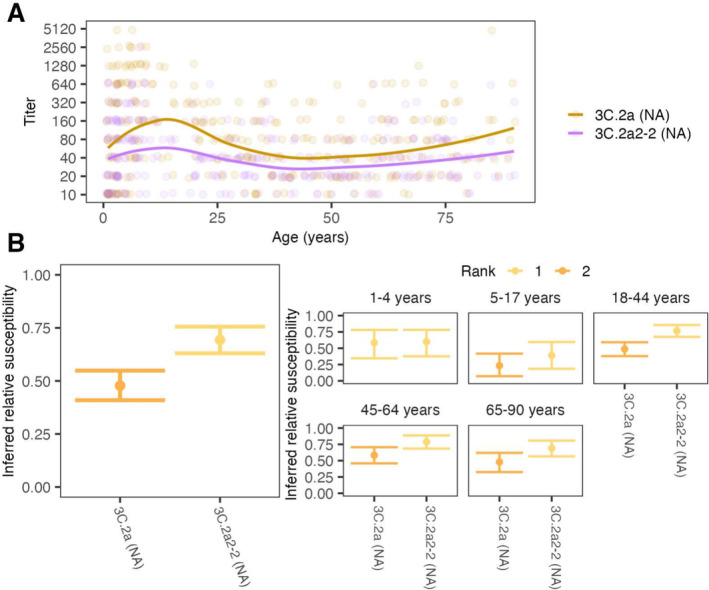
FIGURE 3.

Antibody titers and relative susceptibilities to co‐circulating N2 strains show differences by strain and age group. (A) ELLA titers with points jittered slightly along the ‐ and ‐axes. Lines are locally estimated scatterplot smoothing (LOESS) curves of geometric mean titers (smoothing parameter , degree ). (B) Inferred relative susceptibility and its rank for each NA for the whole population (left) and by age group (right). A lower rank indicates significantly higher susceptibility. Strains are tied in rank and appear in the same color if their relative susceptibilities do not differ significantly.
