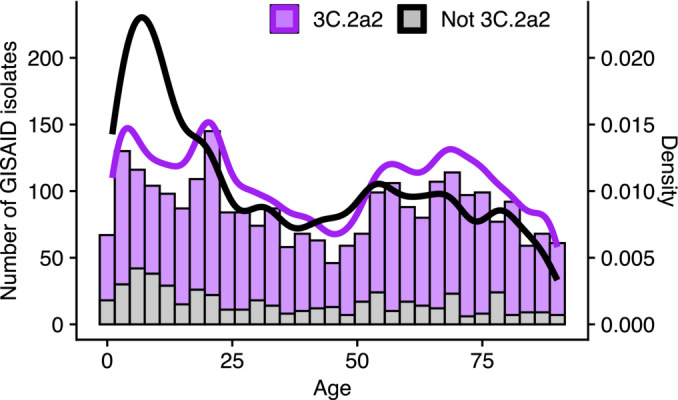
FIGURE 4.

Host age distribution of H3N2 isolates sampled in the United States during the 2017/18 season. We obtained isolate data from GISAID. Viruses from clade 3C.2a2 are shown in purple, and viruses from all other clades combined are shown in gray (bars are overplotted). 3C.2a2 isolates were more common across all ages than viruses from other clades combined, but viruses from other clades were proportionally more common in children relative to adults.
