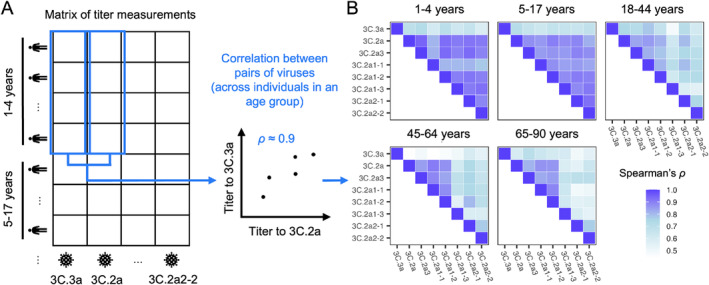
FIGURE 5.

Correlations in titers to different clades. (A) Schematics demonstrating how we calculated the correlation in titers to each strain pair across people in each age group. For these analyses, we randomly imputed continuous titer values between consecutive dilutions (e.g., a titer of 160 was replaced by a continuous value between 160 and 320 drawn with uniform probability). For each pair of viruses and each age group, we report the average Spearman correlation coefficient across 1000 replicate imputations. We removed individuals with undetectable titers across all reference viruses. (B) Correlations between titers to different strains differ by age group, suggesting age‐dependent patterns of epitope targeting.
