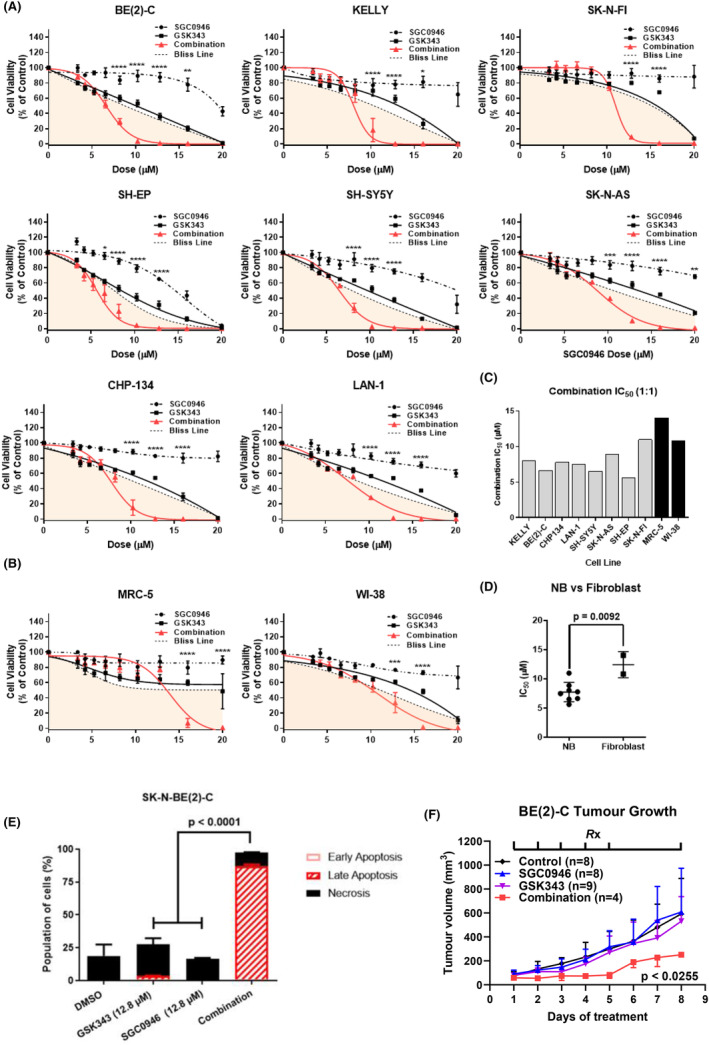
FIGURE 2.

SGC0946 combined with GSK343 has high selectivity against neuroblastoma cells. (A) Resazurin cell viability assays were performed on a panel of 8 neuroblastoma (NB) cell lines (SK‐N‐BE(2)‐C, CHP134, KELLY, SH‐SY5Y, LAN‐1, SK‐N‐AS, SH‐EP and SK‐N‐FI) 72 h posttreatment using an expanded dose range (9‐point) for SGC0946, GSK343 or the combination of these drugs in a 1:1 ratio. (B) The same cell viability assays were performed in human fibroblast cell lines (MRC‐5, WI‐38). Error bars represent the standard error of the mean for at least three independent experiments. For each plot a ‘Bliss Line’ is provided, which represents the expected result if both compounds were additive in nature, and values below the line in the shaded region indicate synergistic dose combinations. Furthermore, p‐values are reported for significant differences between the combination and both single‐agents using two‐way anova analyses (*p < 0.05, **p < 0.01, ***p < 0.001, ****p < 0.0001). (C) IC50's for the combination of drugs are presented in a column graph for the eight neuroblastoma and two fibroblast cell lines. (D) IC50's is grouped into neuroblastoma (NB) cell lines or fibroblast categories. Reported p‐value is from a two‐sided unpaired t‐test between the two groups. Error bars represent the standard error of the mean IC50's for each group. (E) Apoptotic and necrotic effects of the single agents and combination treatment were determined following pre‐treatment of SK‐N‐BE(2)‐C cells for 24 h before collecting the cells and staining with Annexin V/7‐AAD. Staining was detected by FACS analysis. A summary of results is shown as the percentage of cells in early or late apoptosis, and necrosis as histograms. Significance was determined from three independent experiments. (F) Tumour growth curves of Balb/c nude mice, xenografted with SK‐N‐BE(2)‐C cells, following treatment with either a vehicle control, 30 mg/kg/day SGC0946, 30 mg/kg/day GSK343 or the combination of these treatments. The treatment schedule (Rx) is indicated on the top of the plot, wherein drugs were administered on a 5 day on and 2 days off schedule with intraperitoneal injections. Averaged tumour growth curves are shown for time points where all mice in each treatment arm were alive. The reported p‐value is from the comparison between combination and single agent/control treatments derived from a one‐way anova with mixed‐effects analysis, corrected with Tukey's multiple comparison test. Error bars represent the standard error of the mean and are one‐sided for visualisation.
