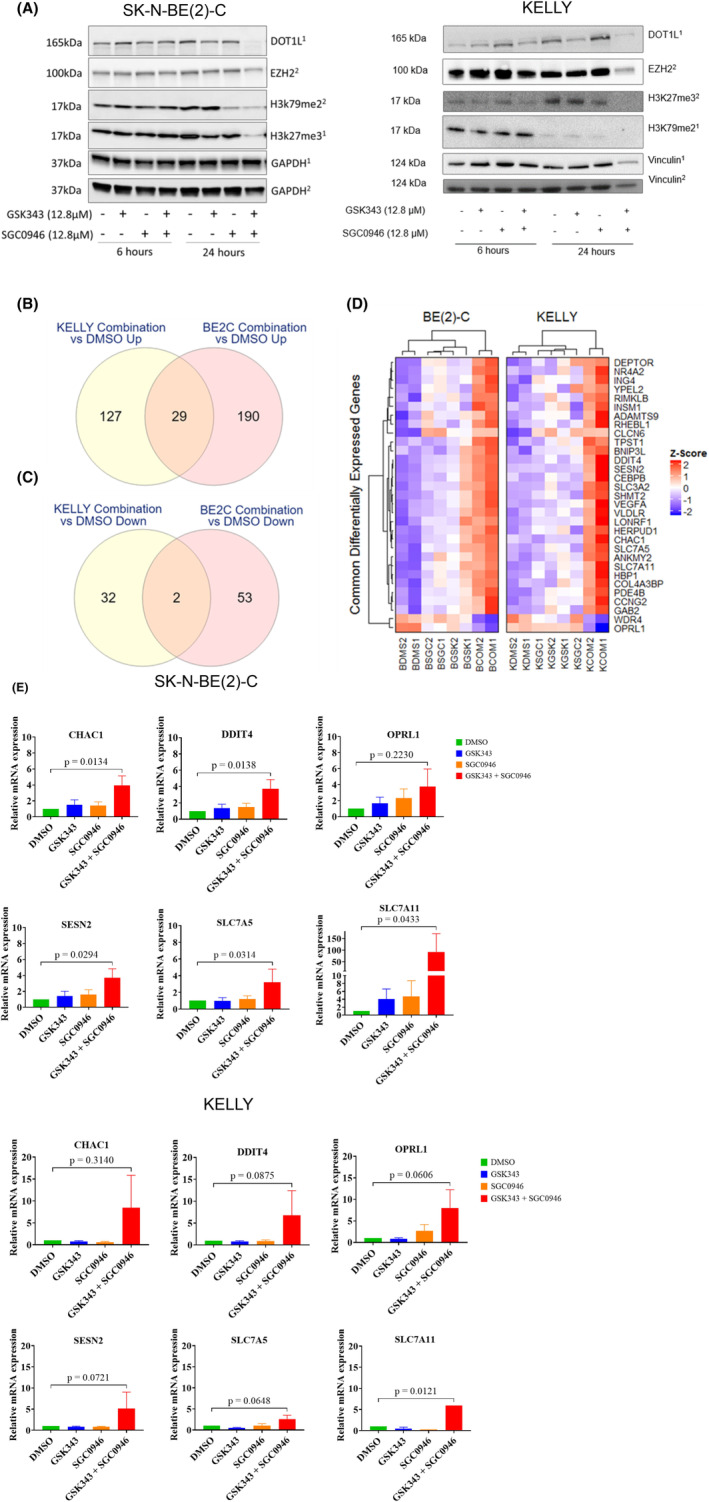
FIGURE 4.

Combination therapy induces an ER stress response expression profile in NB cells. (A) Western blot analyses of cell lysates from treated cells for DOT1L, EZH2, H3K27me3, H3K79me2, Vinculin and GAPDH proteins. Cells were treated with a DMSO vehicle control or 12.8 μM of drug for 6 or 24 h followed by protein extraction. The size at which bands were detected (kDa) are shown to the left of the plot and respective treatment conditions/time points are shown below the plot. Specific antibodies were probed on different blots, where superscripts 1 and 2 annotated on the right of the plot indicates matching blots. (B, C) Venn diagrams depict the number of common differentially expressed genes (B) upregulated or (C) down‐regulated by the combination treatment in both SK‐N‐BE(2)‐C and KELLY cells. (D) Scaled gene expression heatmap of 31 common differentially expressed genes between SK‐N‐BE(2)‐C (B) and KELLY (K) cells after combination treatment. Columns represent individual replicates of the conditions (DMS = DMSO Control, SGC=SGC0946, GSK = GSK343, COM = Combination) and rows represent commonly regulated genes, both of which were hierarchically clustered. Gene expression scale (z‐score) is provided to the right of the heatmap. (E) qRT‐PCR assessing the mRNA expression levels of the top six ER stress target genes CHAC1, DDIT4, OPRL1, SESN2, SLC7A5 and SLC7A11 in SK‐N‐BE(2)‐C and KELLY cells from the microarray. The cells were treated with DMSO control, GSK343 (12.8 μM), SGC0946 (12.8 μM) and with combination of GSK343 and SGC0946 (1:1) for 6 h. For relative quantification of mRNA expression, expression levels of cells treated with DMSO were set to 1. Bars depict mean values ± standard error of the mean (SEM) of three different experiments. PCR reactions were performed in triplicates.
