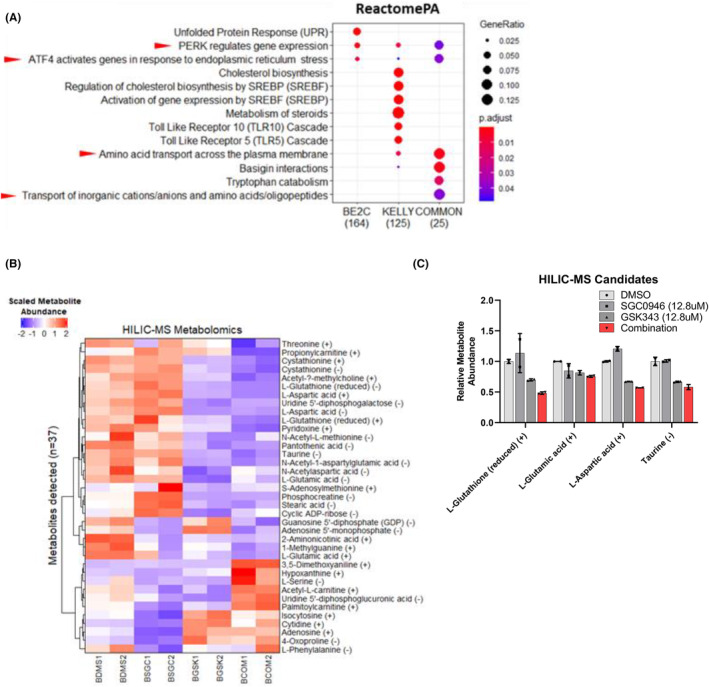
FIGURE 5.

Gene set analyses in combination treated SK‐N‐BE(2)‐C and KELLY cells reveals an ATF4‐driven ER stress response. (A) Over‐representation analyses (ORA) using differentially expressed genes in combination treated KELLY or SK‐N‐BE(2)‐C cells versus control were performed using the ReactomePA database. The ‘COMMON’ differentially expressed genes previously identified were also used as input for each analysis. The results are represented as enrichment dot plots, wherein the size of the dot represents the gene ratio (number of genes in gene set/total number of genes in gene set) and the colour of the dot represents the Benjamini‐Hochberg adjusted p‐value after a Fisher's exact test for each pathway. The number of differentially expressed genes in the presented gene sets are also indicated below each plot. Only significantly over‐represented gene sets are shown (adjusted p < 0.05). Red arrows indicate either ATF4, ER stress or amino acid related gene sets. (B) Glutathione (GSH) and several amino acids are depleted by the combination of SGC0946 and GSK343. SK‐N‐BE(2)‐C cells were treated for 6 h followed by metabolomic profiling using hydrophilic interaction chromatography mass spectrometry (HILIC‐MS). Heatmap of HILIC‐MS detected metabolites, where rows represent metabolites (n = 37) and the columns represent samples. A scale bar is provided at the top left of the plot, indicating scaled metabolite abundance. HILIC separates positively (+) and negatively (−) charged metabolites. Some metabolites have both positively and negatively charged groups and therefore appear in both fractions. (C) Select HILIC‐MS metabolite candidates which were significantly changed in the combination treated cells compared with DMSO. Relative metabolite abundances (to the DMSO control) are provided for reduced GSH and the amino acids; glutamate, aspartate and taurine. Error bars represent the standard error of the mean.
