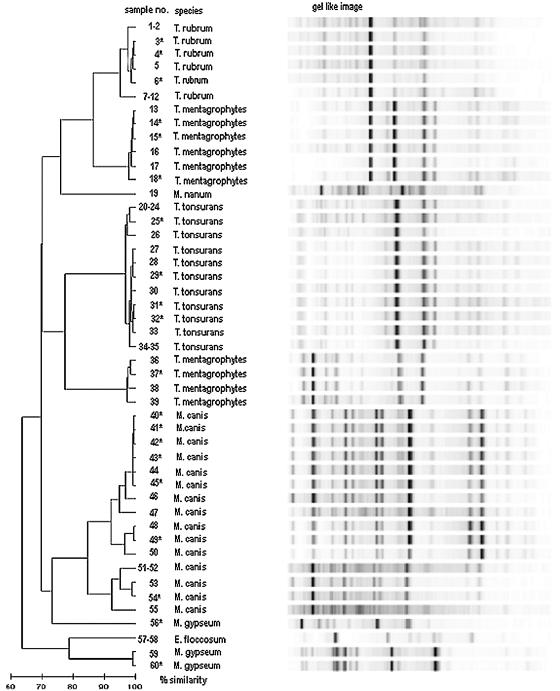
FIG. 1.
Dendrogram of dermatophyte cultures tested at Spectral Genomics in Phase 1 of the study, excluding the contaminated culture. Gel-like images are created by the DiversiLab system. Coded cultures tested in the second part of phase 1 are marked with an asterisk. The horizontal bar at the bottom left of the dendrogram indicates the percent similarity coefficient within the species. Gel-like images of uncoded samples in the first part of phase 1 with ≥99% similarity were condensed. Coded cultures were not condensed.

