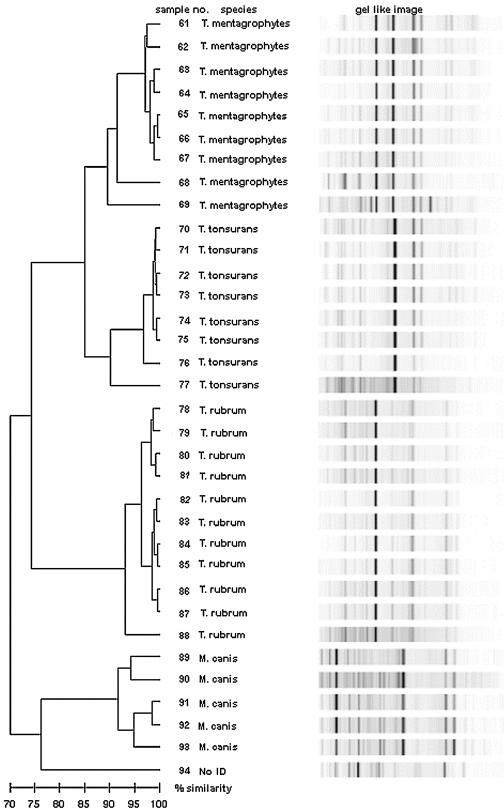
FIG. 2.
Dendrogram of dermatophyte cultures tested at ARUP in the second portion of Phase 2 of the study, excluding the contaminated culture. The horizontal bar at the bottom left of the dendrogram indicates the percent similarity coefficient within the species. Sample numbers 89 and 90 are different colony types from the same culture. No ID, isolate could not be identified.

