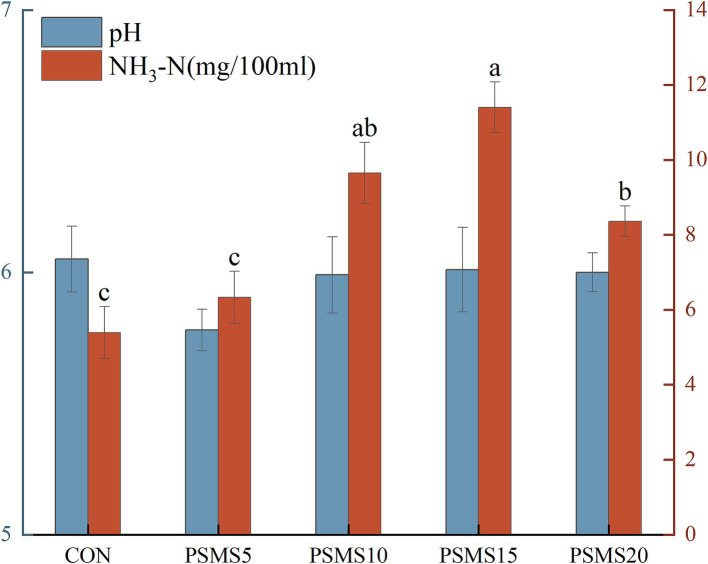
Figure 1.
Effects of different proportions of P.SMS on rumen pH and NH3-N in sheep. The labels ‘a,’ ‘b,’ and ‘c’ above the bars indicate significant differences between different groups (p < 0.05). The absence of labels indicates no significant difference. P.SMS replaced WPCS at levels of 0%, CON; 5%, PSMS5; 10%, PSMS10; 15%, PSMS15; or 20%, PSMS20.

